Support: Creating Reports from Databases/Hosts
Creating from Adis Insight - Web
Using BizInt Smart Charts for Drug Pipelines, you can create pipeline reports from R&D Insight and clinical trials reports from Clinical Trials Insight.
Note: You are limited to exporting 500 records per export and chemical structures can be exported.
Step by Step
- Log in to the Adis Insight system.
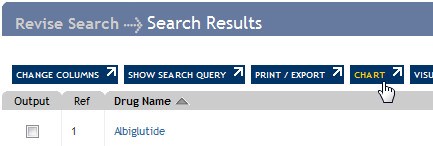
- Conduct your search, selecting the records you want to export, and click the “Chart” button, as pictured.
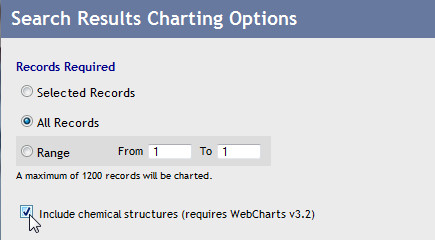
- You will be presented with the "Charting Options" screen. Select “All Records” and “Include chemical structures” to export all records with chemical structure images. Click the CONTINUE button.
- Depending on how your computer is configured, BizInt Smart Charts for Drug Pipelines may launch automatically. If it does not, you will see a dialog from your browser asking what you want to do with the file. You may save this file, to import at a later time, or open the file directly.
If you have BizInt WebCharts for Adis Insight installed on your computer, that program may be launched rather than BizInt Smart Charts for Drug Pipelines. Save the new chart in BizInt Web Charts, and open this .WCT file in BizInt Smart Charts.
Updated 19 August 2012.


Copyright © 1996-2026 BizInt Solutions, Inc. All Rights Reserved