BizInt Smart Charts for Patents helps you create, customize and distribute tabular reports combining data from the leading patent, IP sequence and non-patent literature databases.
Import the results of your searches and create reports from supported hosts and databases including STN, Orbit, PatBase, Derwent Patent Search, GenomeQuest, Patsnap, and more.
BizInt Smart Charts for Patents is Windows software installed on your desktop, and is compatible with Windows 10 and Windows 11.
click image to learn more |
Import search results and create reports
|

click image to learn more |
Customize your report
|
click image to learn more |
Integrate data from different sources
|
click image to learn more |
Update reports and identify changes
|
click image to learn more |
Distribute reports to your clients and colleagues
|
Export your search results from leading databases and hosts in the supported BizInt Smart Charts format.
Learn more at: Creating reports from databases and hosts
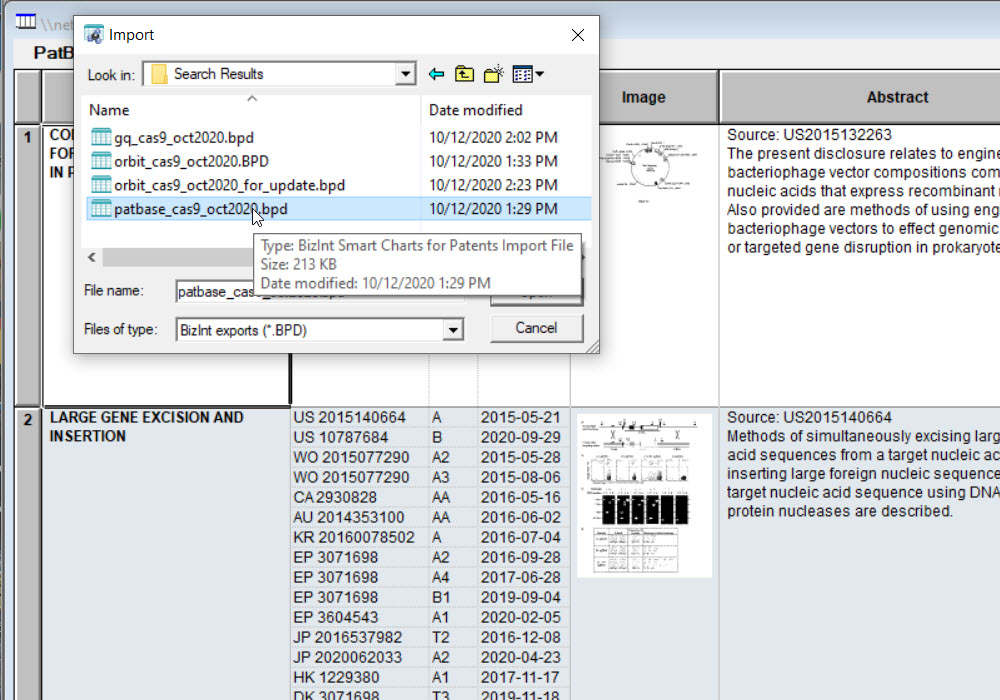
Then use File | Import -- BizInt Smart Charts knows how to process your data, and quickly creates a report with text, images, subtables (e.g. Patent Family) and backing records.
No more need for copy/paste or maintaining Excel macros!
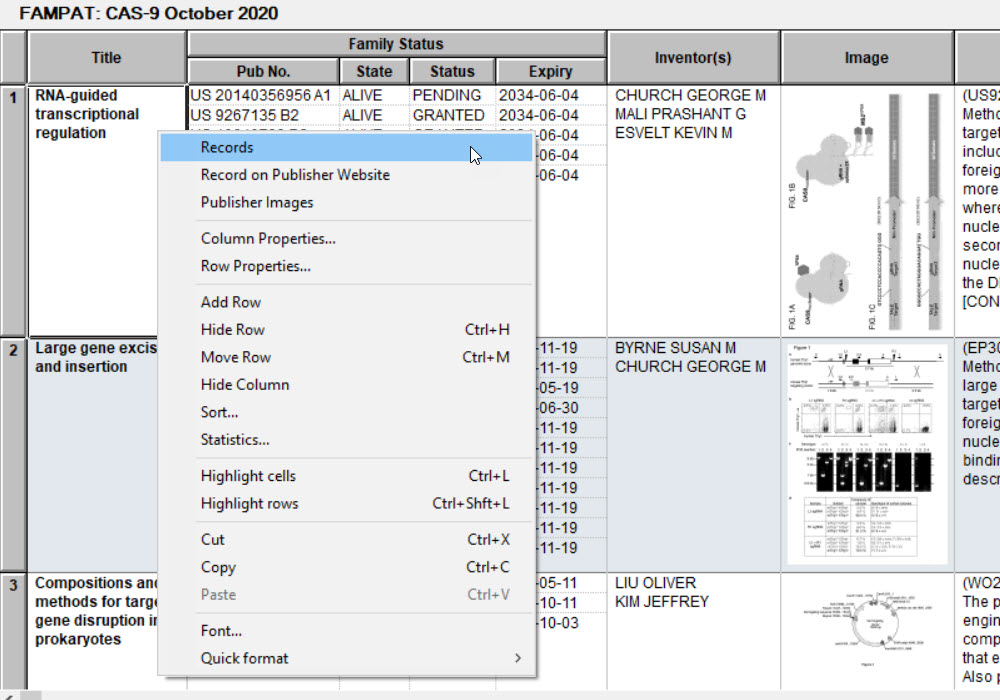
Each record appears as a row in your tabular report, which can contain text, subtables and images. All the information in your export is included in the chart file and available for your report.
You can view backing records for each row, or follow links to the records on the publisher website.
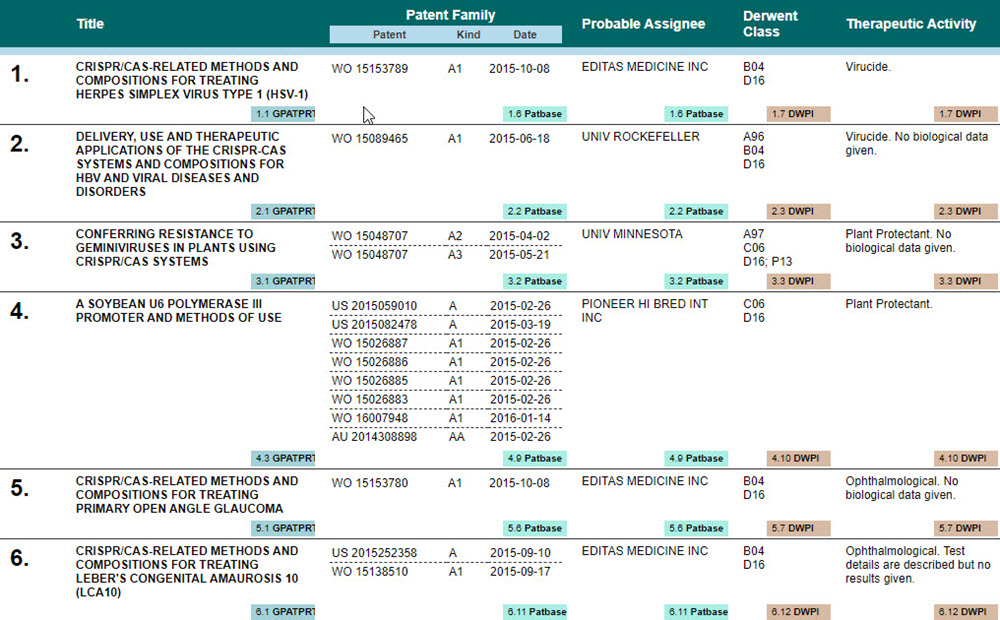
Use View | Columns to change the columns in your report. Since all the data is in your chart file, you can make these changes at any time!
The Selected Columns panel (at right) shows the currently visible columns in your chart. Additional columns are shown in the Available Columns panel on the left. Use the arrows (or double-click) to add or remove columns from your chart.
You can change the order of columns by dragging or using the buttons.
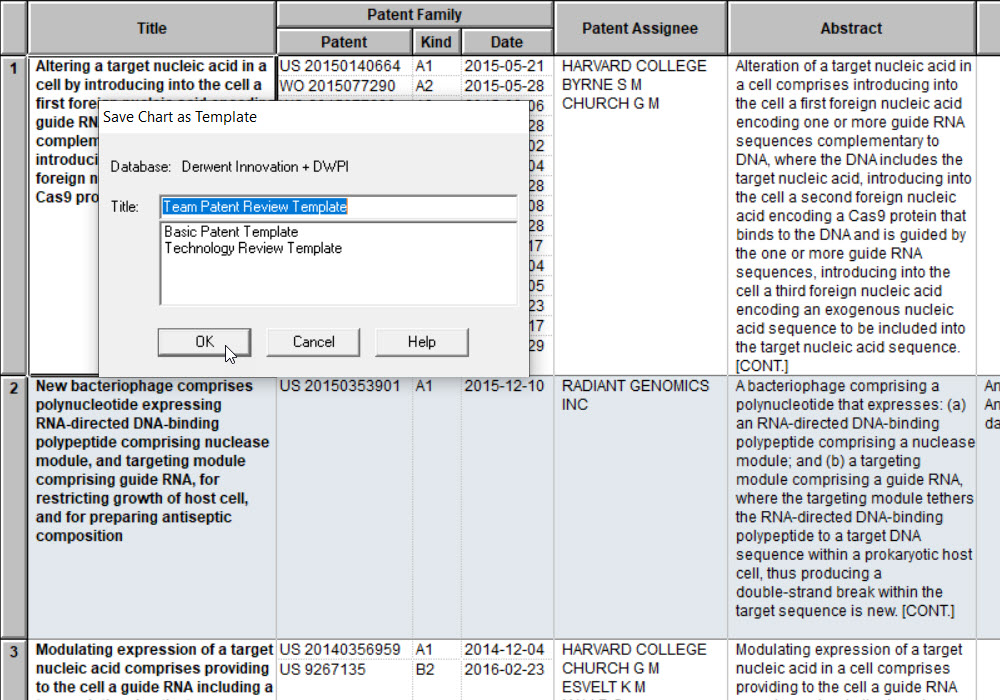
You can save column selections and other chart options as a template using File | Save as Template.
The template will be available the next time you import data from the same source, or you can apply it using View | Apply Template.
Templates are saved as files on your PC so you can share them with your colleagues.
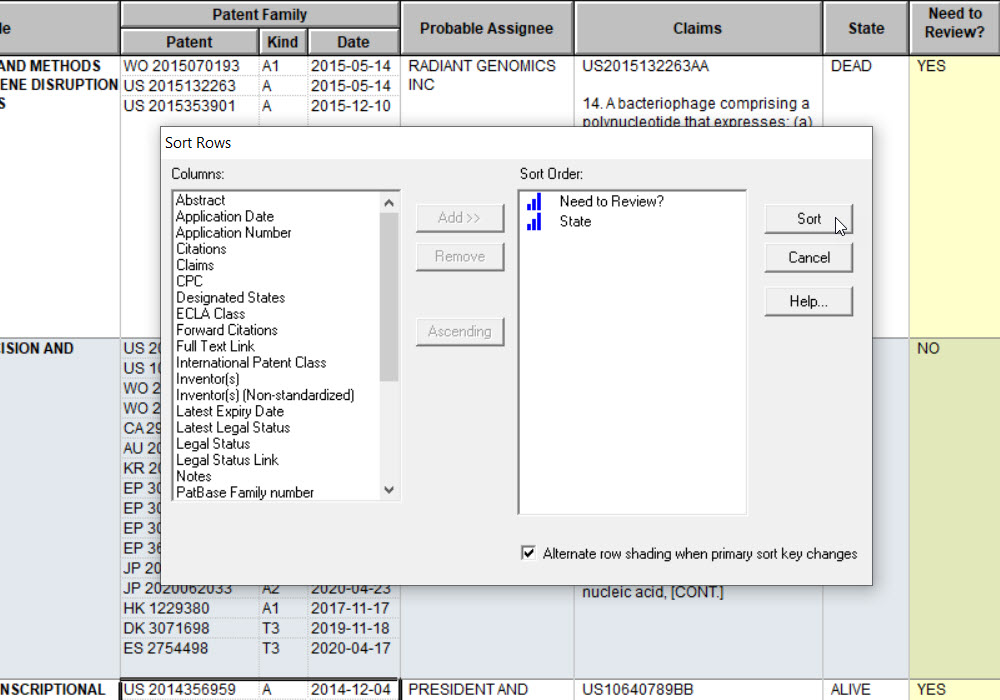
You can sort on multiple columns and in ascending or descending order using View | Sort.
Add new columns for comments and keywords using Edit | Add Column, and use these columns to sort your report.
You can edit text in any cell, and apply a yellow highlight to cells, columns or rows.
Read the Mini Guide to learn more about customizing reports.
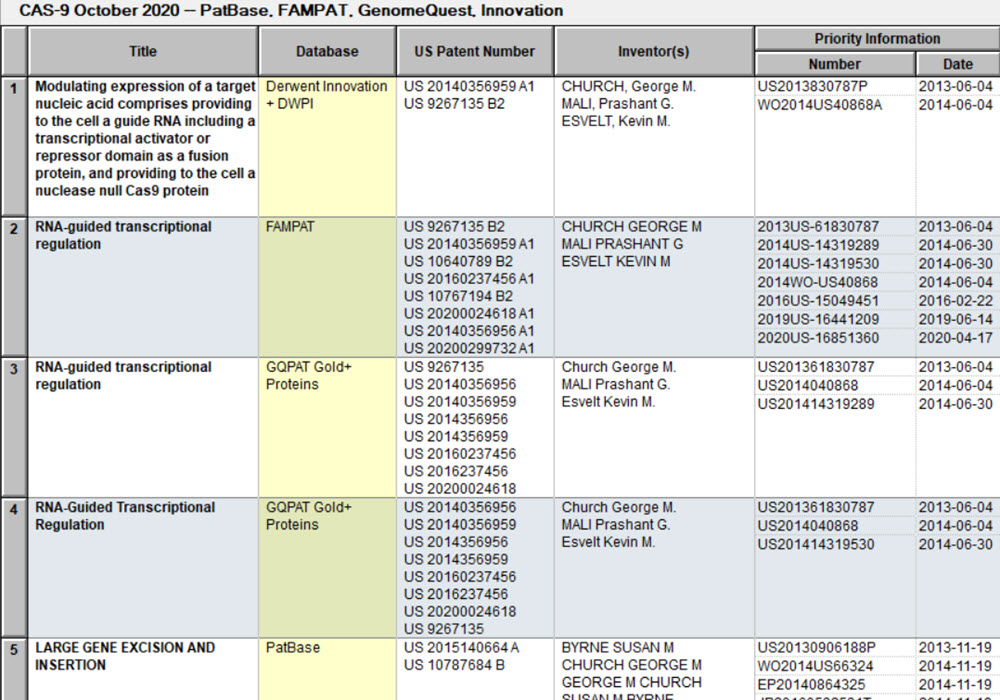
Use File | Combine to combine reports from different databases into a new combined chart.
The combined chart contains all the rows from the original charts, with the Database column showing the source of each row.
Columns with similar data from different databases are automatically mapped into a single column.
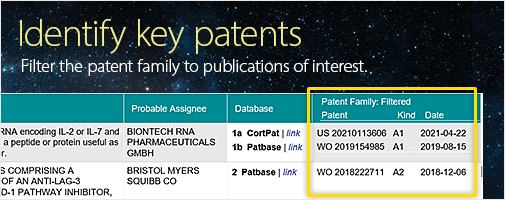
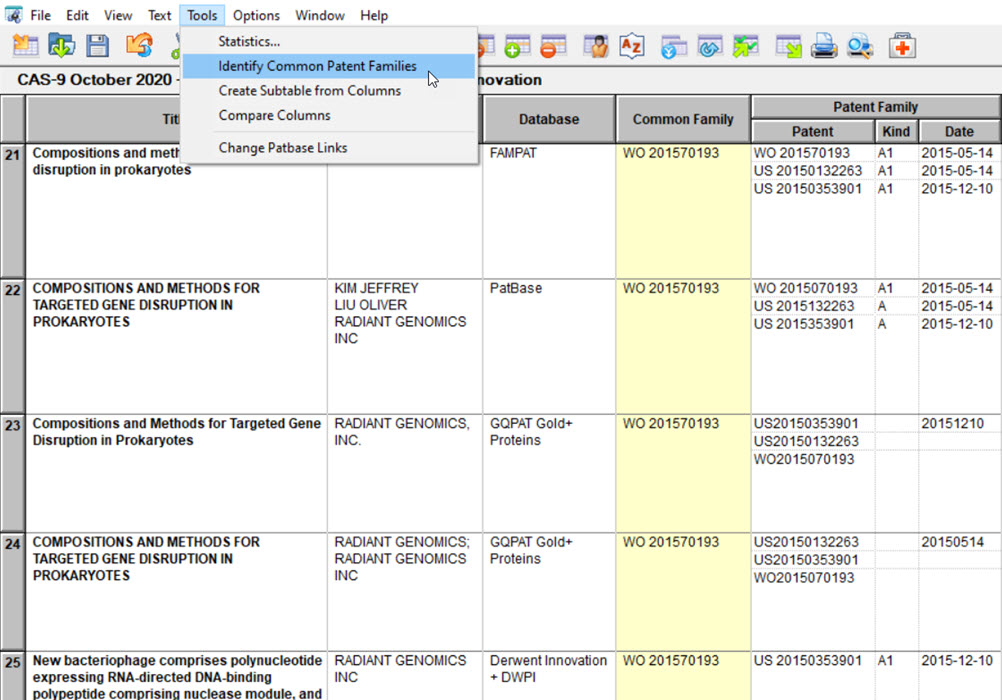
Use Tools | Identify Common Patent Family to identify related records across databases.
BizInt Smart Charts examines publication numbers and assigns a Common Family ID to related records.
You can sort on the Common Family column to bring related records together in the combined chart.
Use the Reference Rows utility (included with BizInt Smart Charts) to stitch together selected data elements into a single integrated row for each family in your final exported report.
Data for each set of related records is selected based on user-defined database rankings and rules.
Learn more about creating integrated reports with Reference Rows in the Mini Guide.
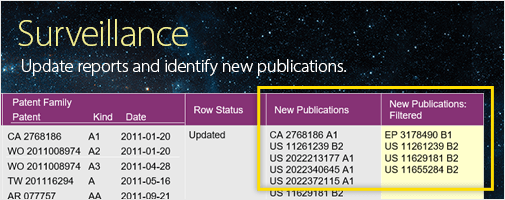
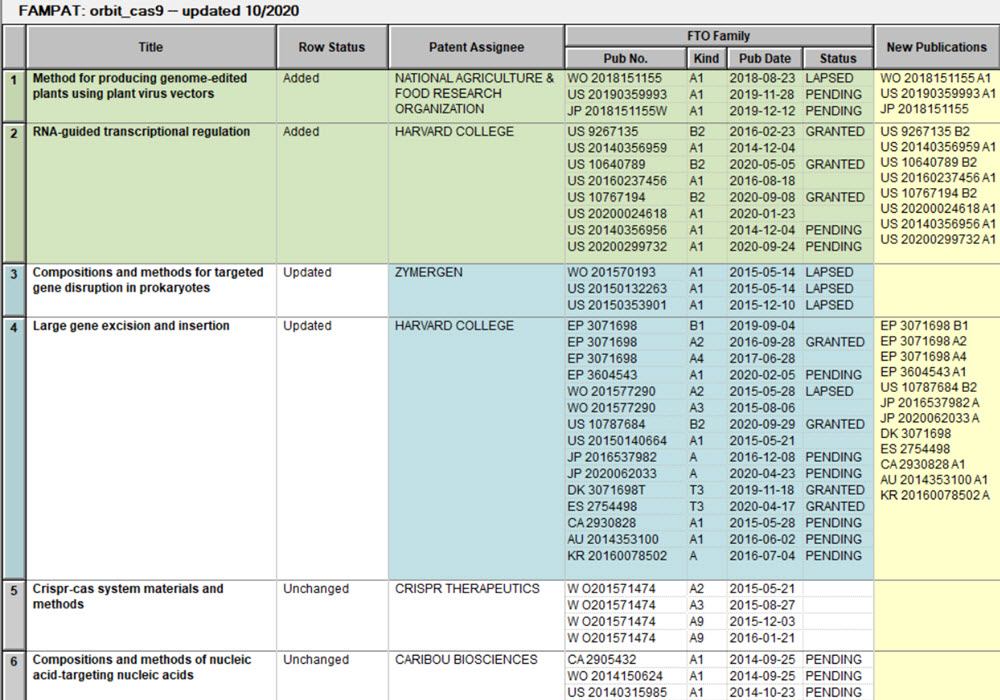
Use File | Update to update a previous report with a chart file of new results.
The Row Status column in the new report identifies records which are new, updated and unchanged.
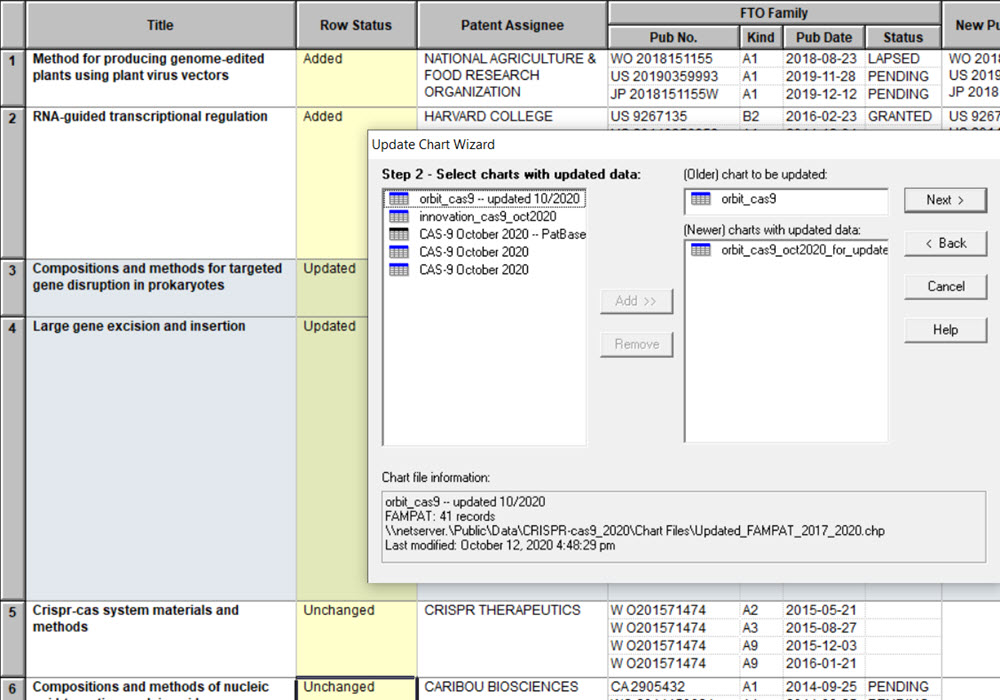
To help you spot changes in updated reports, new records are highlighted in green, and cells with changed information in updated records are highlighted in blue.
The New Publications column shows new family members from a new or updated Patent Family column.
Learn more about updating reports in the Mini Guide.
Use File | Export to export reports to a wide range of formats, including HTML, Word, Excel, and Acrobat.
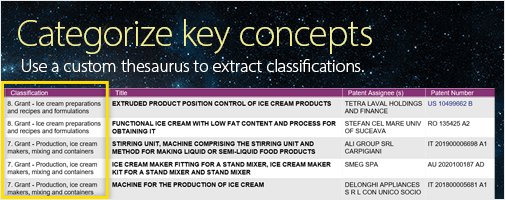
You can also export to VantagePoint - Smart Charts Edition to cleanup and filter your data, create visualizations, and return refined data to your BizInt Smart Charts report.
Learn more about exporting reports in the Mini Guide.
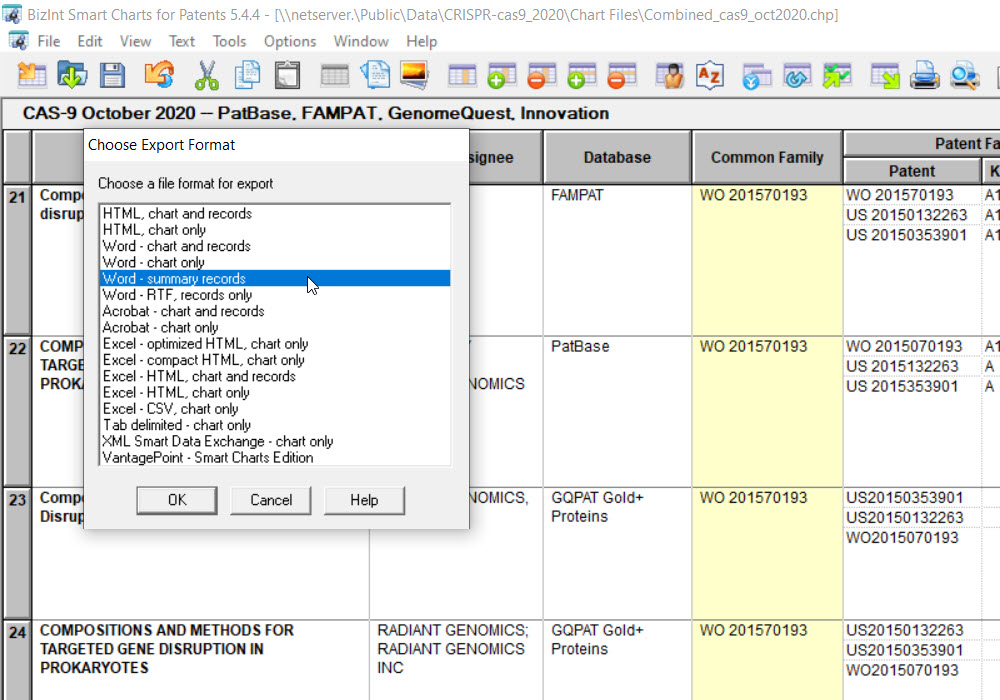
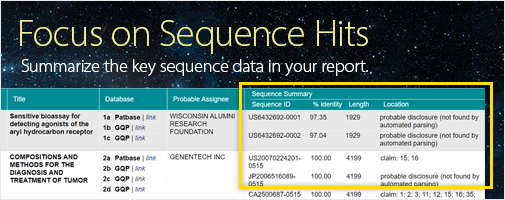
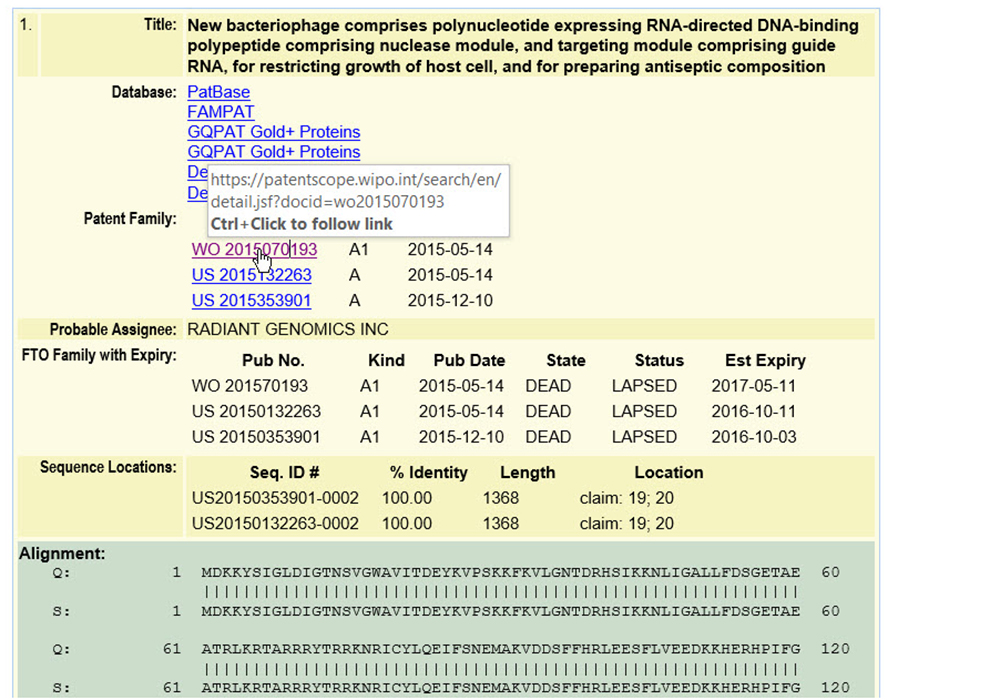
The Summary Records export to Word offers one option for exporting records, with the fields from the table in the yellow area and large fields such as claims and alignments in the green area.
You can specify links from publication, NCT and NOI numbers to a wide range of full-text sources. In this example, links from WO publications are automatically generated for Patentscope.
Learn more about exports and creating links in the Mini Guide.

If you have any questions or suggestions, please contact us at support@bizint.com.