Resources
COVID-19 Vaccines - Dashboard
The COVID-19 pandemic generated intense interest in efforts by the global pharmaceutical community to develop COVID-19 vaccines. Starting in July 2020, the BizInt Smart Charts team applied tools in the BizInt Smart Charts product family, including VantagePoint – Smart Charts Edition (VP-SCE), to create visualizations of the COVID-19 vaccine landscape. These visualizations offer insight into the development of COVID-19 vaccines and how BizInt Smart Charts tools can be used to develop and update drug landscapes.
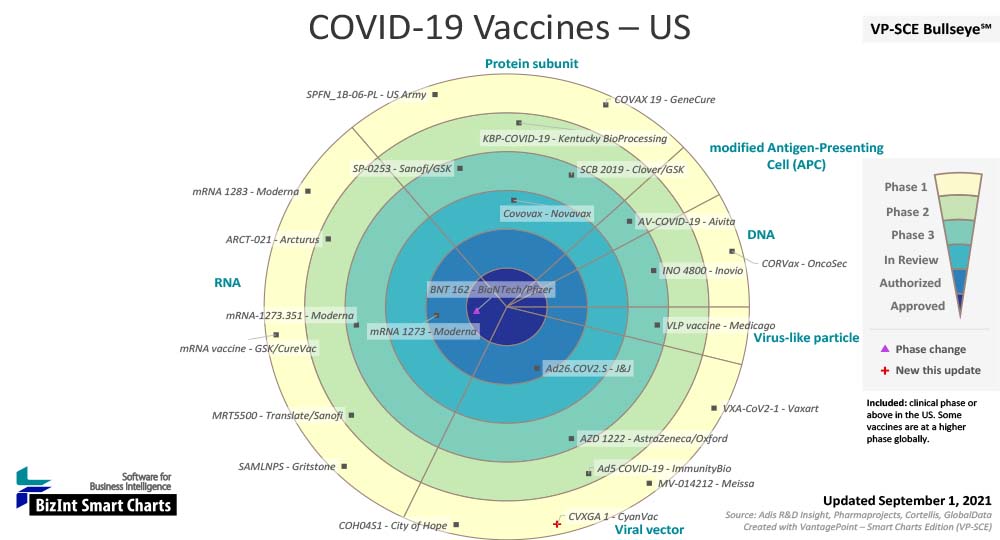
- Bullseye: provides an ‘at-a-glance’ review of the vaccine landscape – showing highest trial phase, vaccine technology, and lead organization for each vaccine. Learn more about how the COVID-19 vaccine bullseye evolved from July 2020 to September 2021.
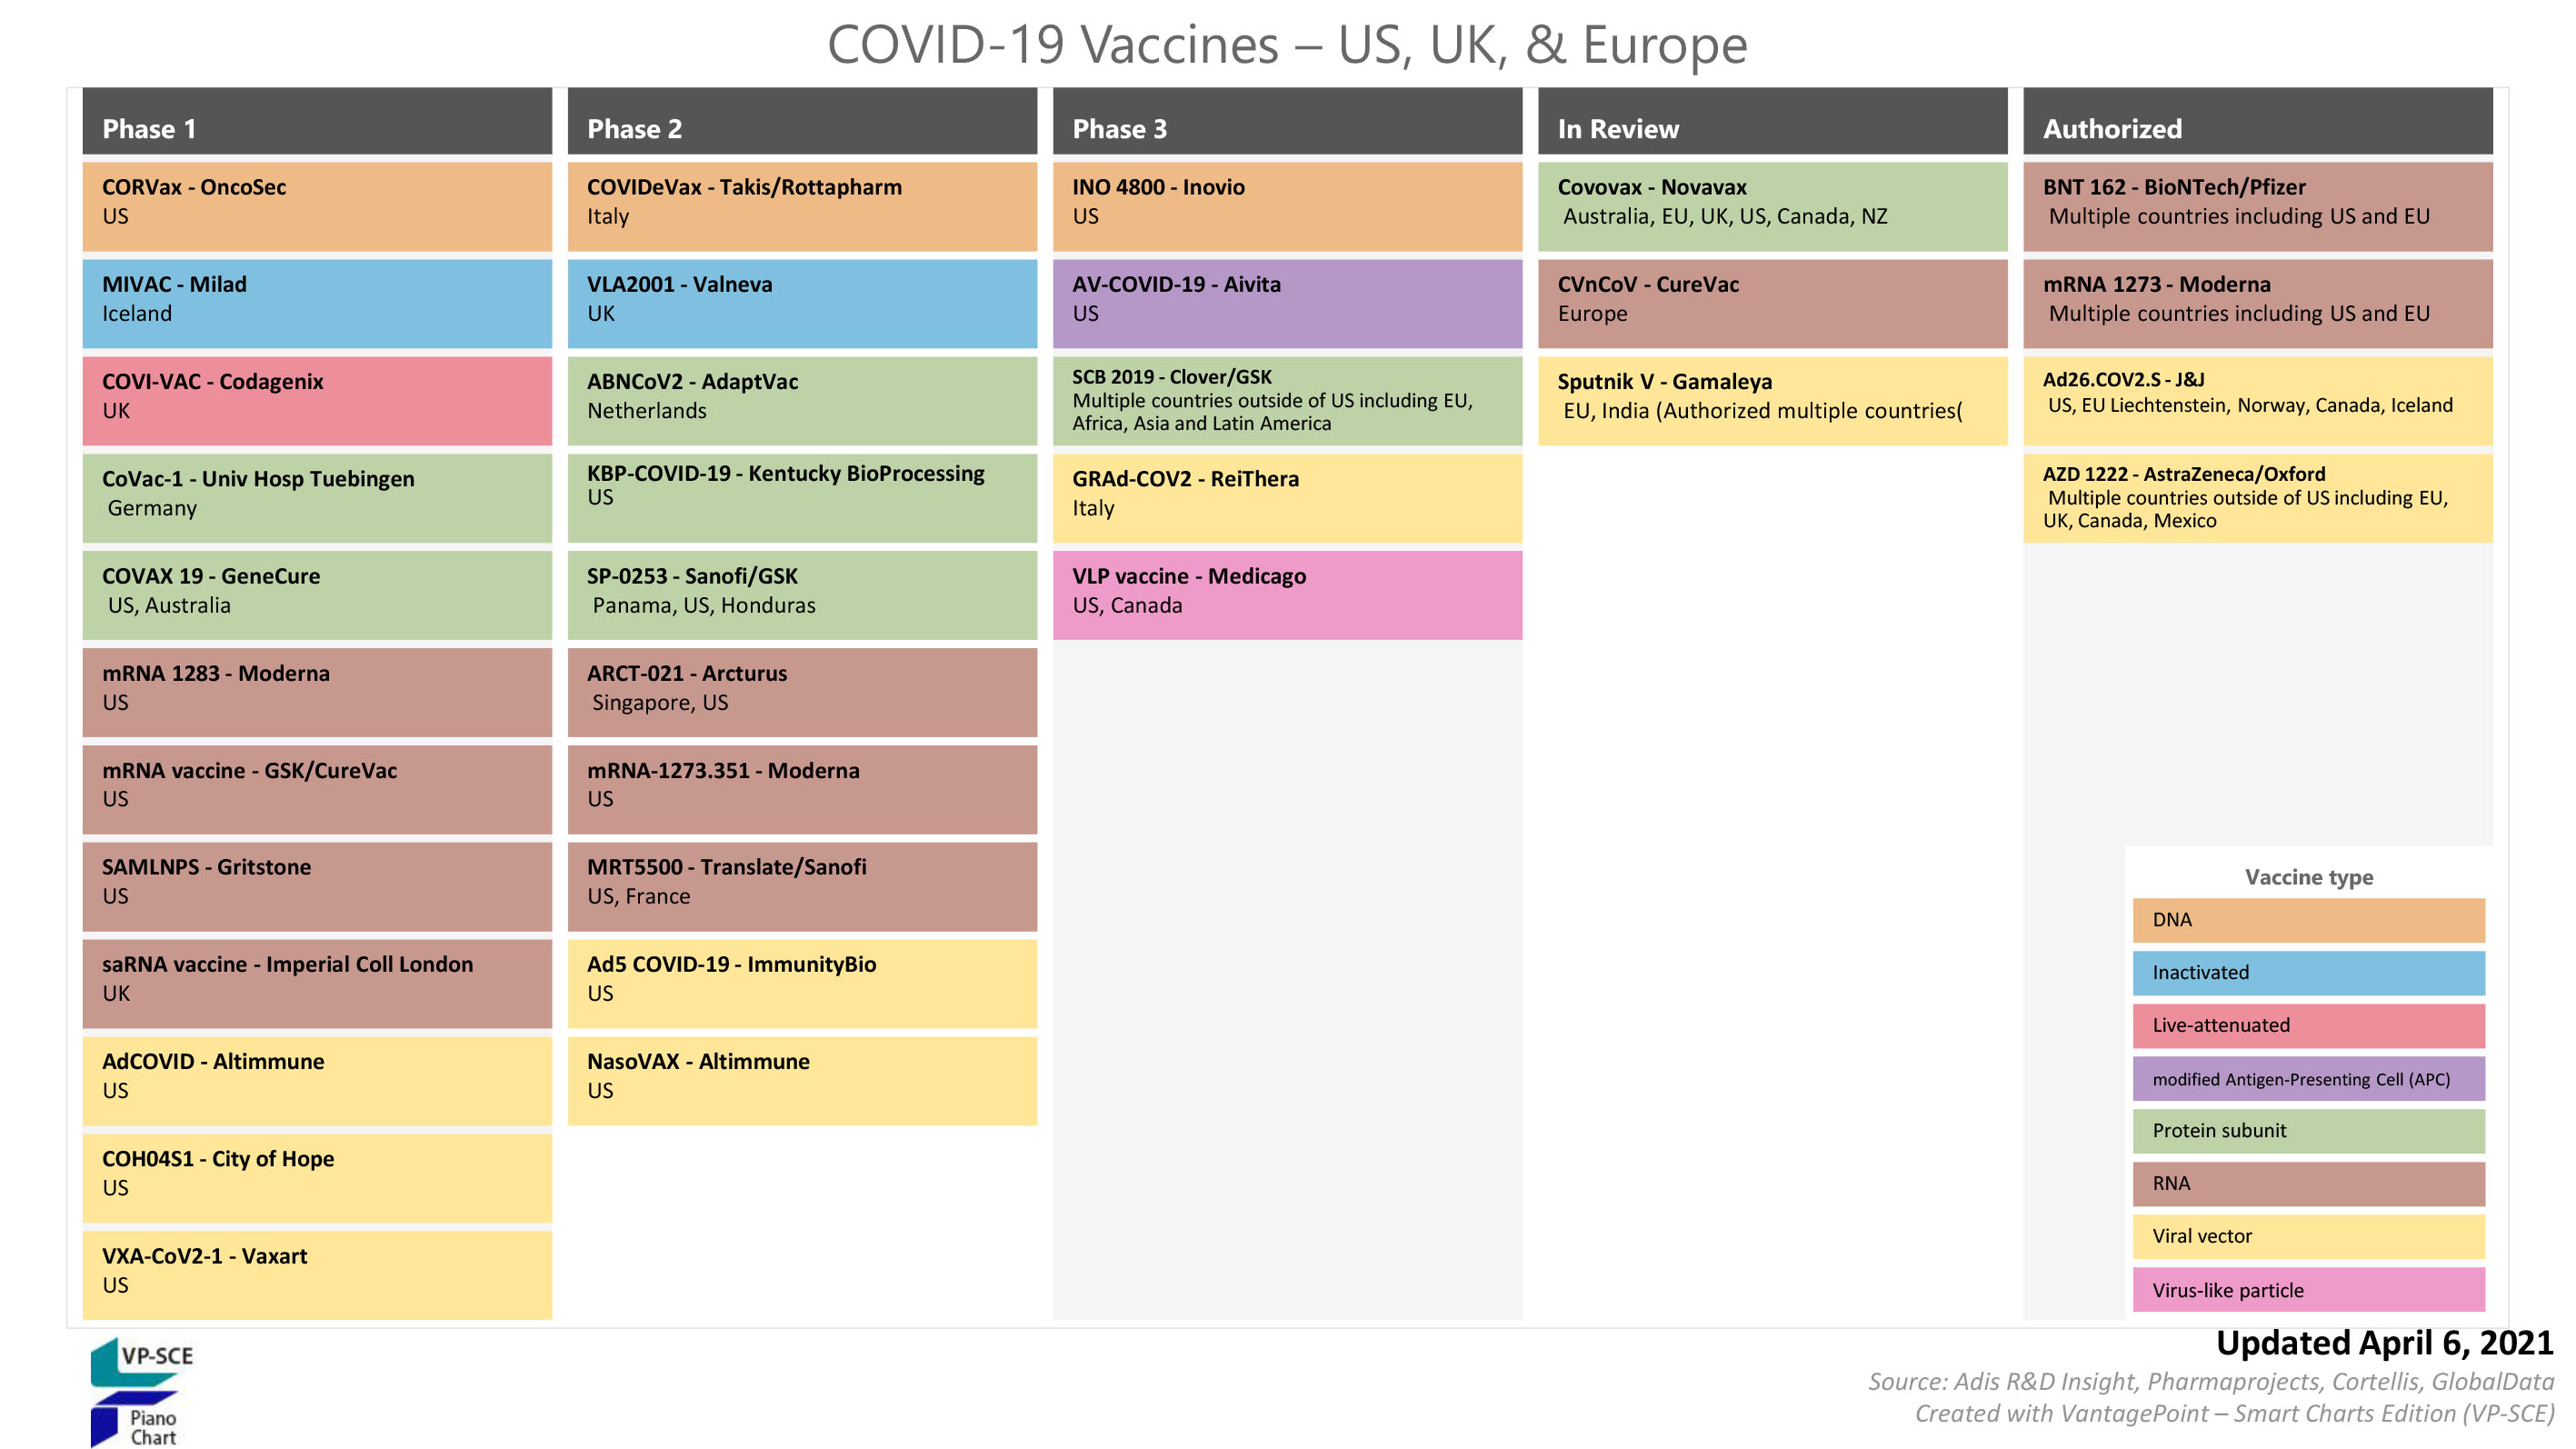
- Piano Chart: offers an alternative visualization of vaccines by phase, color coded by vaccine technology.
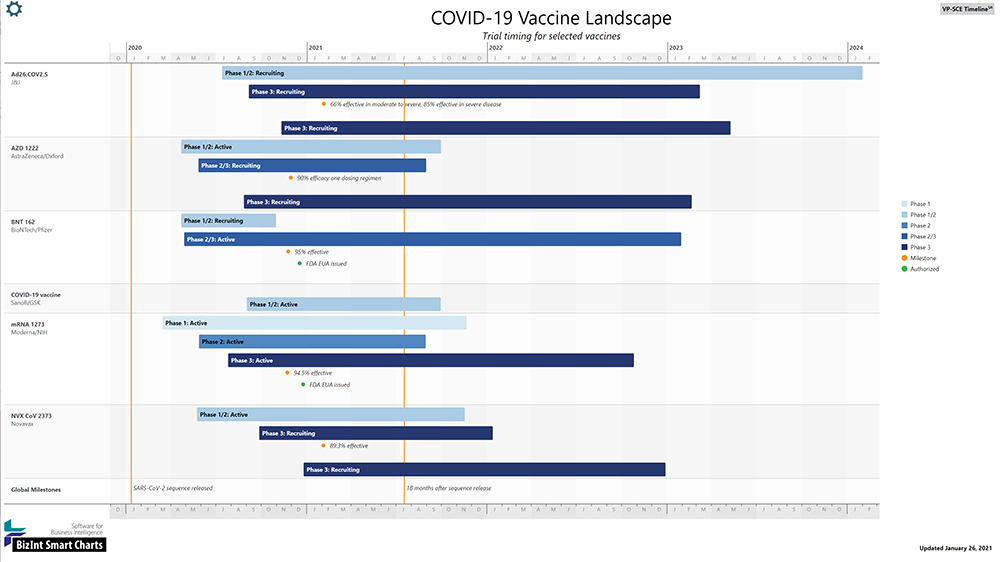
- Timeline: shows trials in progress for selected COVID-19 vaccines, with the status and duration of key trials, as well as selected milestones.
COVID-19 Vaccine Dashboard
Pipeline Bullseye
[Visualization 1/4]
Our VP-SCE Bullseye is a compact way to show development progress of a number of projects divided into groups. This bullseye presents COVID-19 vaccines in clinical trials in the US, Europe and UK, grouped by vaccine technology. Vaccines are plotted by the highest phase in the US, UK or Europe.
Sources: Citeline Pharmaprojects, Adis R&D Insight, Cortellis
Bullseye
[Visualization 2/4]
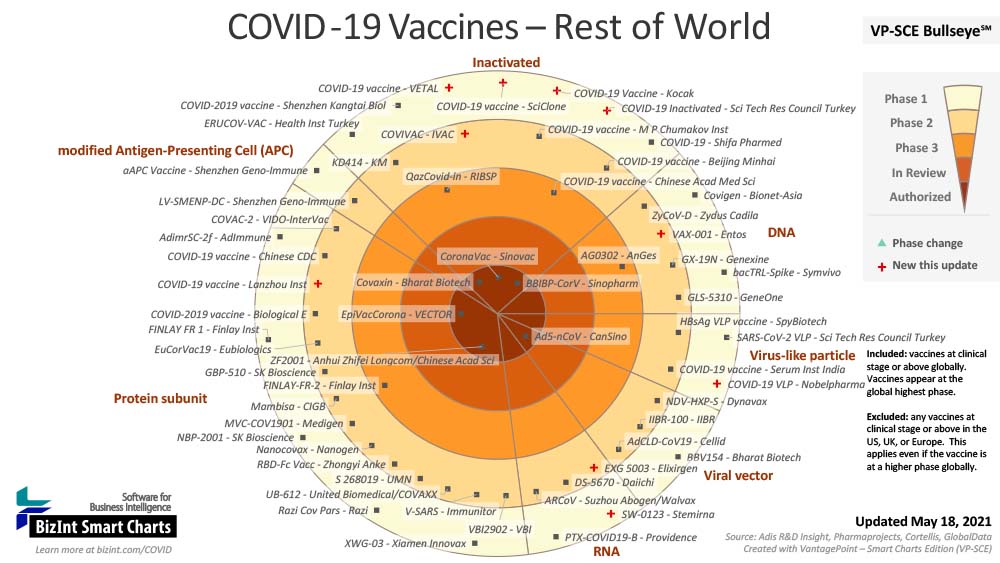
Our VP-SCE Bullseye is a compact way to show development progress of a number of projects divided into groups. This bullseye presents COVID-19 vaccines which are not in clinical trials in the US, Europe and UK, grouped by vaccine technology. Vaccines are plotted by the highest phase.
Sources: Citeline Pharmaprojects, Adis R&D Insight, Cortellis
Trial Timeline
[Visualization 3/4]
This VP-SCE Timeline shows trials in progress for selected COVID-19 vaccines. We have labeled each vaccine with a commonly used name, and by the organizations leading the development.
For each vaccine project, we show the status and duration of key trials, as well as selected milestones from the press.
Piano Chart
[Visualization 4/4]
The VP-SCE Piano Chart is another way to display drugs by phase. This piano chart shows COVID-19 vaccines by phase, color coded by vaccine technology.
The bullseye and piano charts are based on commercial drug pipeline databases and other visualizations, such as the timeline, are derived from data on ClinicalTrials.gov. BizInt Smart Charts tools were used to analyze, filter and refine search results, and the visualizations were generated with VantagePoint - Smart Charts Edition (VP-SCE).
We discussed some of the lessons learned from this project in a presentation "Building visualizations to uncover insights in clinical trial and pipeline data: a COVID-19 vaccine case study" in March 2021.
Do You Find the Dashboard Interesting?
The COVID-19 Vaccine Dashboard is an example of a BizDash project. BizDash (BizInt Smart Strategy Dashboards) is a service offered by the BizInt team. We use BizInt Smart Charts tools with supported drug pipeline, clinical trial and biomedical literature databases to create data-centric reports and visualizations targeted to your analytic needs.
Contact us if you would like to learn more.
Updated 28 March 2022

