Products: VantagePoint - Smart Charts Edition
Piano Charts - Drug Pipelines
New - Released in June 2016!
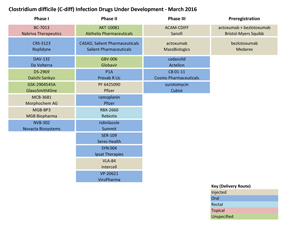
The Piano Chart is a graphical presentation of a drug development pipeline. In this presentation, each product is represented by a box, stacked in columns by phase of developments. These columns of boxes often appear like the keys on a piano, giving the chart its name.
 A Piano Chart is created from data retrieved from one or more drug pipeline databases in BizInt Smart Charts for Drug Pipelines, results are integrated with BizInt Smart Charts Reference Rows, data is normalized in VantagePoint - Smart Charts Edition, and then the Piano Chart is rendered in Microsoft PowerPoint or Microsoft Excel.
Sample Piano Chart (PowerPoint)
Creating Piano Charts with Vantage Point - Smart Charts Edition
You can learn how to create your own Piano Charts with these recipes from our Cookbook of Reports and Visualizations.
Instructions for Installing Piano Chart files (June 2016): Current VP-SCE users will need to add the files for creating Piano Charts to their VP-SCE installation.
These recipes show how to create piano charts from drug pipeline data, but you can also use them to create an overview of the clinical trial landscape or even to review a set of patents.

