Products: VantagePoint - Smart Charts Edition
Training examples
Ready to get started learning how to use VantagePoint - Smart Charts Edition (VP-SCE)?
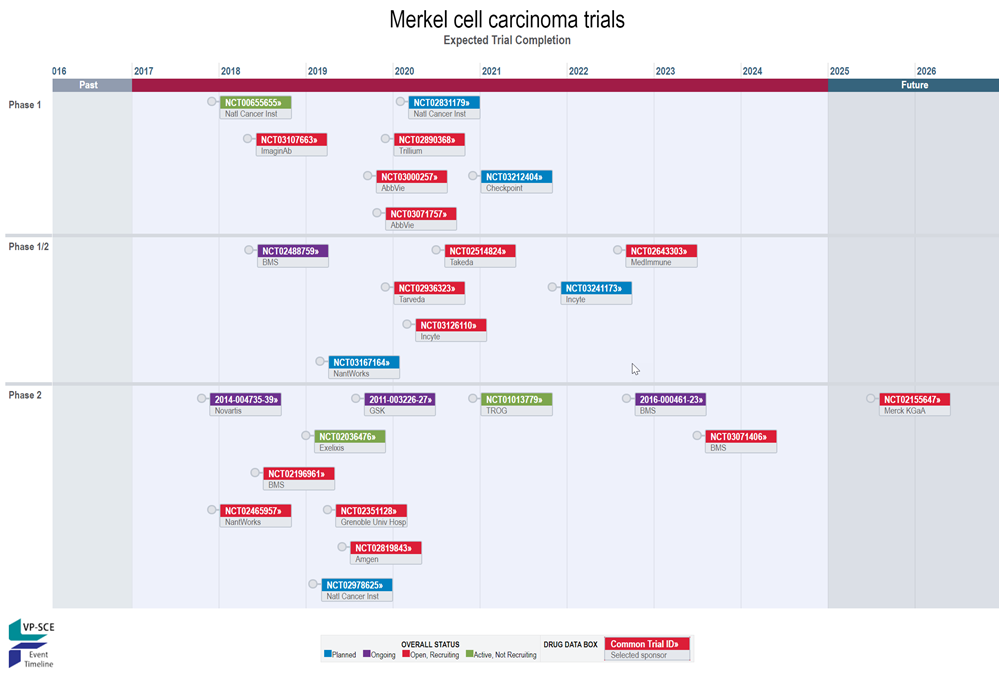
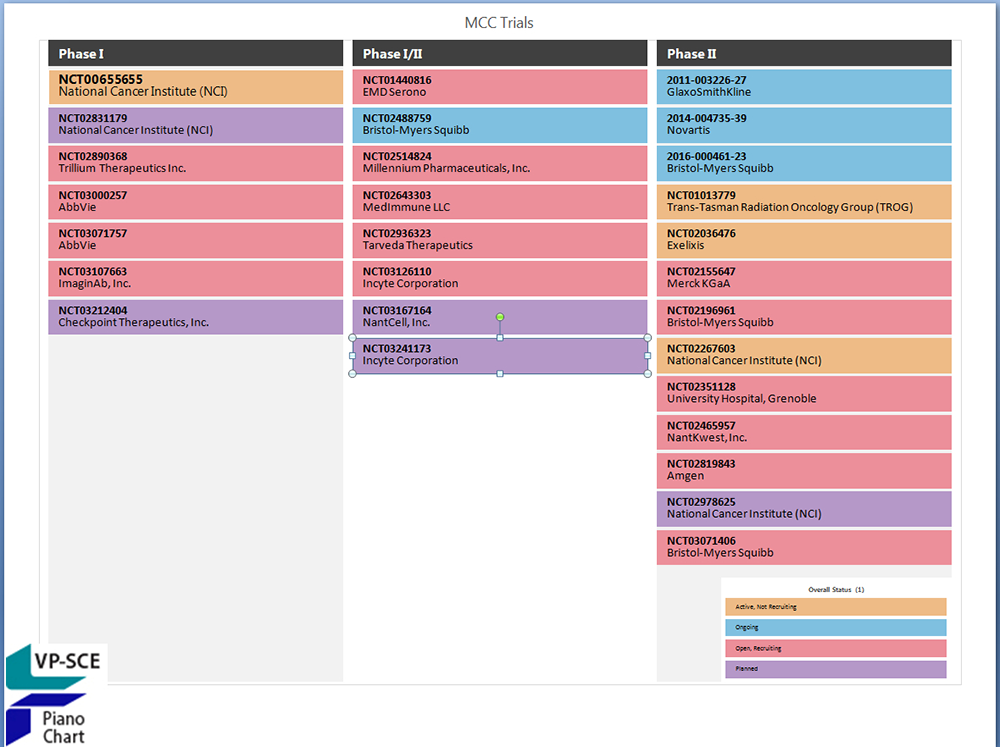
We've put together a sample data set and two recipes to help you learn how to use VP-SCE to create a clinical trial piano chart and bullseye in Powerpoint, and a trial completion timeline in HTML. Using a file exported from BizInt Smart Charts, you will learn how to do basic data clean-up in order to create these visualizations.
Note: these recipes require Version 11 of VantagePoint - Smart Charts Edition.
click image to enlarge
×
Want a headstart? Attend a webinar or request a web session to build these charts with our assistance.
Here is what you need:
- Training dataset (right click to save this file to your PC or desktop): training.vpxi
- Recipes (including the bullseye, with step-by-step instructions): Training_Recipes_MCC.pdf
- Optional - Workbook (with more detailed instructions):
Workshop 1: Learn the Key Features of VP-SCE V11 by Building a Piano Chart (PDF) - Date thesaurus file -- used with the trial completion timeline to normalize partial dates (right click to save this file to your PC. You should save it to your VantagePoint-SCE\Thesaurus\ folder): FindReplace_MonthYYYY.the
- Type of Compound thesaurus file: Type of Compound_v3.the
click image to enlarge
×


Copyright © 1996-2026 BizInt Solutions, Inc. All Rights Reserved