Support: Tips for Using BizInt Smart Charts
Statistics on multi-database reports
The Statistics tool in BizInt Smart Charts identifies all unique terms in a selected column and provides a count of how many times they appear in the chart.
This tool can help you analyze database coverage in multi-database reports. Statistics are sent to Excel, and you can create a PivotTable for further analysis.
The example below is from a drug pipeline report, using statistics on the Common Drug Name field. You can do a similar report using the Common Trial ID for clinical trials reports, or the Common Patent Family for patents reports.
Step by Step
- Combine searches from drug pipeline databases into a single combined report, and identify related records using Tools | Identify Common Drug Names.
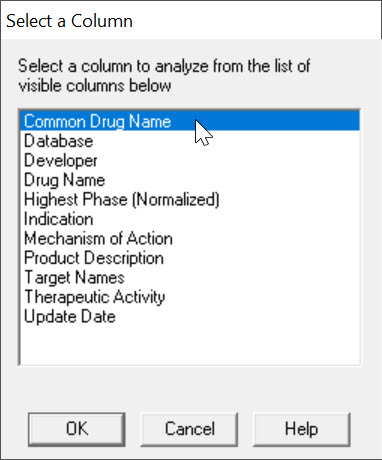
- Select Tools | Statistics..., select the "Common Drug Name" field, and click OK.
- On the options panel, select "Separate lines" and click OK.

- Save your statistics as an Excel file (.csv) and check the "Launch file after creating" box.
- Your statistics will open in Excel, showing each unique Common Drug Name and a count of how many records are in the chart for that Common Drug Name. For a chart created from 3 databases, we would ideally have one Common Drug Name for each drug, with 1 record from each database, for a count of 3.
- Sort on the Count column, from largest to smallest, to see the distribution of record counts for each Common Drug Name. You will typically see several Common Drug Names with several records, but also many retrieved from a single database.

- In Excel, summarize the Common Drug Name statistics using Insert | PivotTable. The entire set of data should be automatically selected. Click OK to start creating your PivotTable.
- Setup your PivotTable as shown below. Select "Count", drag "Count" into Columns, and under Values, click the drop down by "Sum of Count" and select "Value Field Settings". Click on "Count" to select it and then click OK.

- The result is a PivotTable like this:
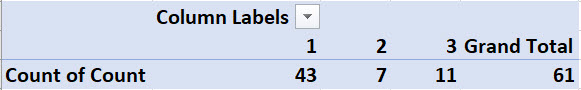
How to read this: There are 61 unique drugs (e.g. Common Drug Names) in this report. 1 record was retrieved for 43 drugs; 2 records for 7 drugs, and 3 records for 11 drugs. This is a typical (actually very good) coverage pattern for a multi-database pipeline report.
Updated April 2021


Copyright © 1996-2026 BizInt Solutions, Inc. All Rights Reserved