Support: Tips for Using BizInt Smart Charts
Using the XML Smart Data Exchange format
[This document describes the first release of the XML Smart Data Exchange support.]
Starting in version 3.4.7 of BizInt Smart Charts for Patents (3.4.5 of BizInt Smart Charts for Drug Pipelines), a new export is available to allow the user to exchange data beween BizInt Smart Charts products and various analysis tools. This page describes how to use the first geneation of this feature.
Export Chart Contents
A new option is available on the File | Export panel called XML Smart Data Exchange [BETA]. This option creates an XML file corresponding to the visible cells in the chart.
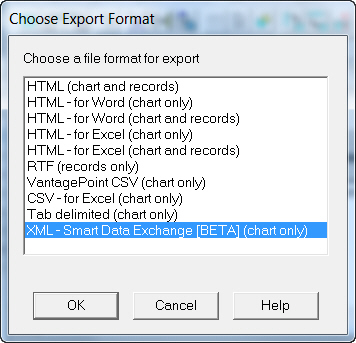
The result is a very simple XML file, suitable for use with analytic tools such as Vantage Point. You can import the saved XML file into Vantage Point 7 using a toolbar command.
At the time this document was published, the format can only be read by a pre-release version of Vantage Point. However other tool vendors are working on adding support, and the XML format has been documented so that users can implement their own analyses using the format.
Examples of Analysis Operations
Some possible ways that you can use an analysis tool in conjunction with your Smart Charts reports include:
- perform clean-up on inventor and patent assignee names;
- normalize indications based on an internal taxonomy;
- classify publications based on text analysis of the abstract or other fields; or,
- select a subset of documents which are of interest.
Once you have completed your analysis, export the results from your analysis tool, using the same XML Smart Data Exchange format. Note that Vantage Point gives you the option of sending the XML file directly to the BizInt Smart Charts product which was used to create the original export.
Note for the first version: when exporting data from your analysis, export only the results (classifications, cleaned up fields, etc), and the recordId meta data. If you export fields which were already present in the chart, a copy will be imported into the chart in the next step.
Import Analysis Results
When you have created an XML file with the results of your analysis, you can bring the results back to your original chart. With the chart open, simply import the XML file created from your analysis. You may use the File | Import command, or simply drag-and-drop the file into BizInt Smart Charts.
If you use the feature of Vantage Point which allows you to send the XML results directly to BizInt Smart Charts, you should first open the chart that you want to add the analysis results into.
BizInt Smart Charts will ask you to select the chart to which the imported data should be applied. Select the chart and press "OK".
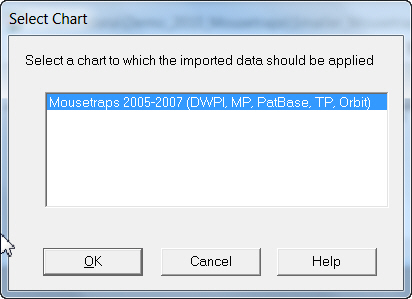
The contents of the analysis results XML will be linked to the appropriate row in the selected chart, and each field in the XML will be presented as a new user-added column in your chart.
![]()

