Support
Cookbook
BizInt Smart Charts - Cookbook of Reports & Visualizations
 The Cookbook provides examples of effective reports and visualizations tools created with the BizInt Smart Charts product family, including VantagePoint - Smart Charts Edition (VP-SCE).
The Cookbook offers step-by-step recipes to help you create reports and visualizations with your own data.
Version 12 Cookbook - updated for 2023:
Cookbook of Reports & Visualizations - VP-SCE Version 12 (Online Flipbook, June 2023).
For use with VP-SCE Version 12. Includes the new milestone timeline, other new VP-SCE Version 12 visualizations, and updated recipes. Updated in 2023 to reflect changes to Reference Rows and exports.
We have also prepared an installation guide for installing and upgrading to Version 12.
Version 11 Cookbooks
Patents/IP Sequence Edition - Version 11 (PDF, October 2020).
Cookbook of Reports & Visualizations - Version 11 (PDF, April 2019) Updated for VP-SCE Version 11.
Looking for previous editions of the Cookbook? You can find them here.
Sample Recipes in the Cookbook
On this training webpage you will find sample data and recipes designed to familiarize you with the features of VantagePoint - Smart Charts Edition (VP-SCE). You will learn to clean-up data and create two visualizations, using a training set of clinical trial data. Updated for Version 11.
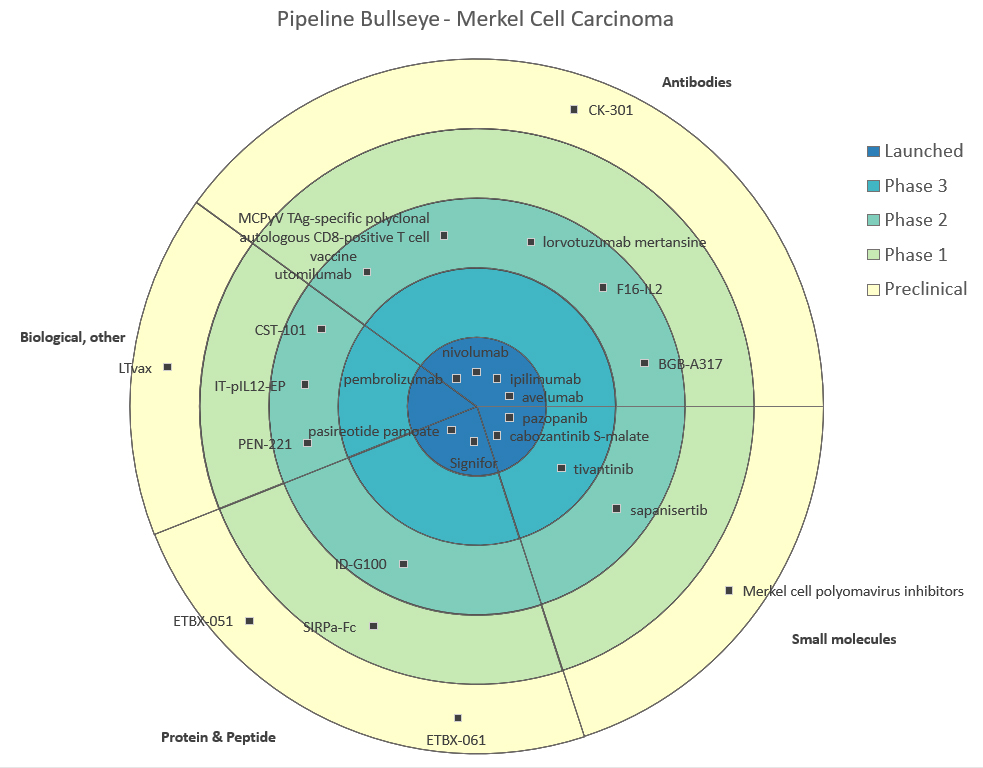
Visualizing the Pipeline with a VP-SCE℠ Bullseye
The VP-SCE Bullseye is one of our flagship custom visualizations. In this recipe, you will learn how to use BizInt Smart Charts Drug Development Suite and VP-SCE to visualize a drug pipeline landscape in a bullseye visualization, created in PowerPoint.
Summarizing Sequence Locations in a Patent Family
In this recipe you will learn how to use features in BizInt Smart Charts Reference Rows to create a subtable summarizing key sequence information for each family. VP-SCE is not required for this recipe.
Creating Piano Charts from Drug Pipeline Data
On this webpage you will find examples and recipes for creating "piano charts", which help you visualize a drug pipeline.
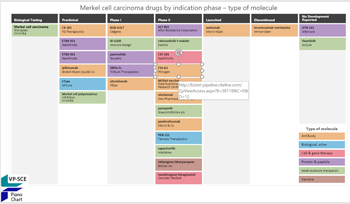
Extracting the Highest Phase for an Indication
In this recipe, you will learn how to use VP-SCE to normalize indications and phase terminology and to create a column in BizInt Smart Charts with a column showing the highest phase for a specific indication.
This recipe shows how to create a launch timeline visualization showing estimated launch dates for a set of drugs arranged into horizontal categories, or lanes.

The "recipes" in the Cookbook make use of the following products in the BizInt Smart Charts product family:
- BizInt Smart Charts Drug Development Suite
- BizInt Smart Charts for Patents
- VantagePoint - BizInt Smart Charts Edition
Previous Editions of the Cookbook
February 2018 (17 MB PDF, updated for VP-SCE 10)
February 2016, 20 MB PDF (updated for VP-SCE 9.1)
October 2015 (use with older versions of VP-SCE)

