Products: VantagePoint - Smart Charts Edition
VP-SCE Bullseye
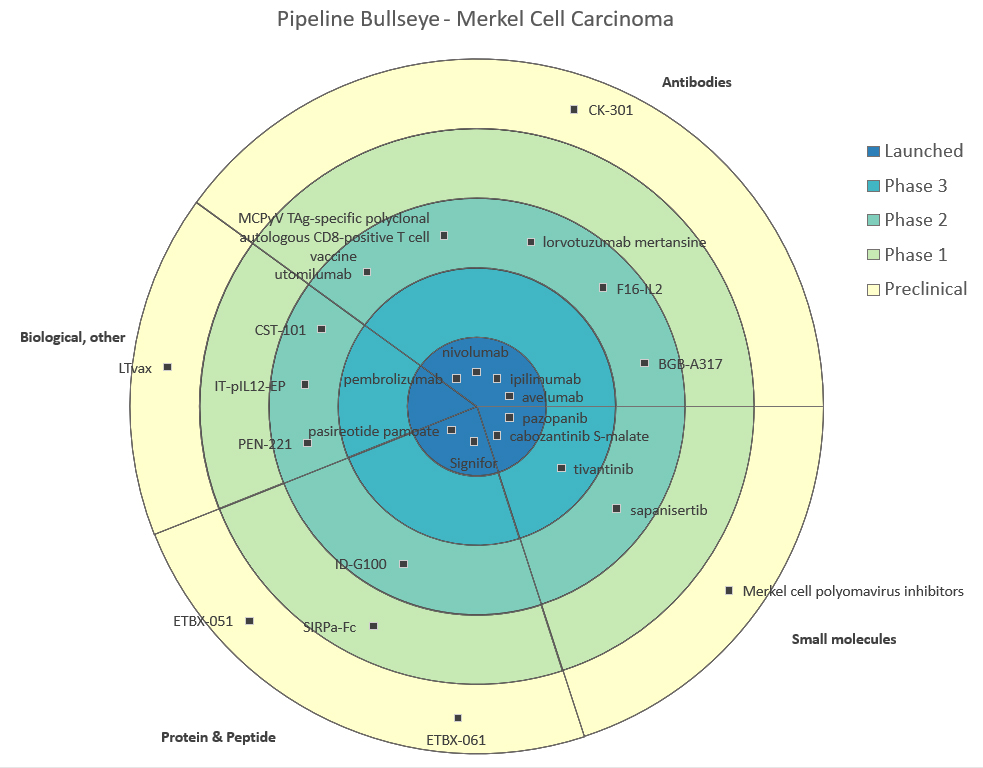
The VP-SCE℠ Bullseye is a concise way to present a drug pipeline (or even a set of trials or patents.) The VP-SCE bullseye displays drugs in concentric rings representing phases, often with marketed drugs in the center. The bullseye is also divided into sectors, which can represent drug technology, indications, mechanisms of action, etc. Each drug is labeled and can even be links to backing records.
BizInt released the VP-SCE Bullseye in 2018 in VantagePoint - Smart Charts Edition Version 11 and continues to enhance it.
The VP-SCE Bullseye is generated automatically from VantagePoint-Smart Charts Edition (VP-SCE) as a set of objects in PowerPoint. This gives the user the option of editing text and styles, adding branding, and making other minor changes. Before generating the bullseye, tools in BizInt Smart Charts Drug Development Suite and VP-SCE assist users to select, filter, clean-up and categorize the data.
The bullseye can be considered a combination of a radial or polar graph and a pie chart. Drugs are plotted in a ring and a sector, but do not have precise coordinates. Traditionally, bullseyes were drawn manually and were very time-consuming to create and maintain.
BizInt identified the bullseye as a key visualization for the pharmaceutical industry several years ago. We discussed the bullseye and challenges in visualizing pharmaceutical information in a series of conference papers:
"Challenges in Visualizing Pharmaceutical Information - Part III: Smart Strategy Dashboards" - presented by Diane Webb at IC-SDV 2018, Nice, France, April 2018.
"Challenges in Visualizing Pharmaceutical Information – Competitive Launch Landscapes" presented by Diane Webb at the 2016 II-SDV conference, Nice, France. April 2016.
"Challenges in Visualizing Pharmaceutical Business Information" presented by Diane Webb at the II-SDV meeting, April 2013. This presentation discusses some of the difficulties encountered when applying standard visualizations to drug pipeline and clinical trial data.
In 2020, BizInt created and maintained a VP-SCE Bullseye visualizing the COVID-19 Vaccine Landscape.
Creating the Bullseye with Vantage Point - Smart Charts Edition
You can learn how to create a bullseye with this recipe from our Cookbook of Reports and Visualizations.


