About Us
BizInt Smart Charts - History
BizInt Smart Charts grew out of the U.S. Government CATALYST program, which led to a "defense conversion" project resulting in the TRW Smart Charts product launch in 1994. In 1996, Diane Webb and John Willmore, leaders of the original TRW Smart Charts team, acquired the software and founded BizInt Solutions in southern California. The company was incorporated in California in 2005. In 2016, we relocated our headquarters to Seattle.
Highlights from the past 30 years
2025
January: Reference Rows is rebranded as the Smart Data Integrator.
March: Support for PatSnap Synapse added in BizInt Smart Charts Drug Development Suite 5.8.
![]() September: New BizDash| Drug Landscapes service announced at the Pharma CI conference in Newark, NJ.
September: New BizDash| Drug Landscapes service announced at the Pharma CI conference in Newark, NJ.
2024
June: New chart creation workflow and template management tools added in BizInt Smart Charts Drug Development Suite 5.8 and BizInt Smart Charts for Patents 5.9
January: Support for PatSnap Analytics added in BizInt Smart Charts for Patents 5.8.
 2023
2023
February: BizInt introduces the "Explore the IP Universe" theme for the PIUG Biotechnology Conference.
May: New Word and Excel exports are introduced in BizInt Smart Charts for Patents 5.8.
 2022
2022
April: BizInt Smart Charts Drug Development Suite 5.5 and BizInt Smart Charts for Patents 5.7 are released with improved Reference Row, statistics and export workflows.
May: BizInt attends the PIUG 2022 Annual Conference -- our first in-person meeting since early 2020. We show our 25th anniversary video and celebrate with cake and champagne.
October: Our 25th anniversary celebration continues at the 2022 PHT Annual Meeting in Philadelphia. Again we celebrated with cake, champagne, and a video looking back at the last 25 years.
2021
March: Support for GlobalData pipeline and trials data added in BizInt Smart Charts Drug Development Suite 5.3.
 June: VantagePoint - Smart Charts Edition Version 12 is released, with new visualizations and a new Cookbook.
November: 25th anniversary of the founding of BizInt Solutions and introduction of BizInt Smart Charts.
December: BizInt Smart Charts Drug Development Suite 5.4 and BizInt Smart Charts for Patents 5.6 are released with new Reference Rows features and workflow, plus support for the BizInt export on STNext.
2020
 February: BizInt attends the PIUG Biotechnology Conference in Cambridge MA, our last in-person conference before the COVID-19 pandemic changes everything.
July: BizInt applies tools in the BizInt Smart Charts product family to create a VP-SCE Bullseye visualization of the COVID-19 Vaccine Landscape.
Fall: First product videos are presented at PIUG, AI-SDV and EPO virtual conferences.
 2019
2019
April: First Analytics and Visualization Meeting (AVM) organized jointly with Search Technology in Nice, France.
April: Diane moderates a "Pipeline and Clinical Trials Intelligence Town Hall" at the PHT Spring Meeting in Philadelphia, with representatives from Citeline, Clarivate and Adis.
September: BizInt Smart Charts for Patents 5.3 is released with a new feature for identifying new publications in updated patent reports.
2018
 April: VantagePoint - Smart Charts Edition Version 11 is released, with a new bullseye visualization.
May: Maddy Marley presents a paper at the 2018 PIUG Annual Conference describing the hit structure project with GSK.
July: BizInt releases Version 5 of BizInt Smart Charts Drug Development Suite and BizInt Smart Charts for Patents, including support for hit structures on STN.
August: Bossa delivers the Vikings -- a litter of five dachshund puppies. We end up keeping a girl, Vinca, and a boy, Vasa.
2017
February: BizInt Smart Charts for Patents Version 4.4 is released.
June: John Willmore and Matt Eberle present posters at the exhibits at the Drug Information Association (DIA) Annual Meeting in Chicago. 
August: BizInt Smart Charts Drug Development Suite Version 4.4.
September: BizInt launches BizInt Smart Strategy Dashboards (BizDash) at RAPS Regulatory Convergence in National Harbor, MD.
October: BizInt Smart Charts for Patents 4.5, with initial support for hit structures on STN, is released at the final ICIC conference in Heidelberg. BizInt first exhibited at ICIC in Nimes in 1998 (see photo at right.)
December: BizInt Smart Charts for Drug Pipelines and BizInt Smart Charts for Clinical Trials are consolidated into a single product - BizInt Smart Charts Drug Development Suite.
2016
 January: Support for Infodesk PipelinePlus is added to Version 4.2 of BizInt Smart Charts Drug Development Suite.
June: BizInt exhibits for the first time at the DIA conference.
August: After 20 years in southern California, BizInt Solutions moves its headquarters to Seattle WA.
November: BizInt Solutions celebrates its 20th Anniversary and gets an office in the Pioneer Building, a National Historic Landmark on Seattle's Pioneer Square.
2015
September: BizInt and Chemical Abstract Service (CAS) announce a partnership to provide a BizInt export for the new STN platform in BizInt Smart Charts for Patents 4.0.
September: Version 4.0 released, including two new products -- BizInt Smart Charts for Clinical Trials and BizInt Smart Charts Drug Development Suite.
October: Support for EudraCT added in Version 4.1 of BizInt Smart Charts for Clinical Trials and BizInt Smart Charts Drug Development Suite.
 2014
2014
February: "Dachshunds wearing chef hats" photos make their first appearance in our "PARP - A Target in 3 Courses" presentation at Pharma CI Europe.
April: Support for Cortellis Clinical Trials in BizInt Smart Charts for Drug Pipelines 3.6.1.
September: Version 3.7 released for BizInt Smart Charts for Patents and BizInt Smart Charts for Drug Pipelines, including Reference Rows 1.2.
2013
July: Matt Eberle joins the BizInt Smart Charts team as Product Specialist.
September: Version 3.6 released for BizInt Smart Charts for Patents and BizInt Smart Charts for Drug Pipelines, including Reference Rows 1.1 with support for Excel export.
2012
June: Version 3.5 released for BizInt Smart Charts for Patents and BizInt Smart Charts for Drug Pipelines.
September: "Cookbook" of reports and visualizations created with the BizInt Smart Charts Product Family distributed at fall conferences.
 December: first customers for VantagePoint - Smart Charts Edition, a collaborative venture with Search Technology. Subtable filtering is released in Version 3.5.6 on 21 December.
2011
Beta versions of BizInt Smart Charts Reference Rows are released in 2011.
 May: Added support for Thomson Innovation in BizInt Smart Charts for Patents 3.4.
7-year old dachshund sisters Asti & Olive are "Sponsors" at PIUG in Cincinnati.
June: Introduced the XML Smart Data Exchange format for exchanging data between BizInt Smart Charts and analysis tools.
November: BizInt Solutions celebrates its
15th anniversary. First clinical trials case study paper is presented at Pharma-Bio-Med conference in Venice.
December: BizInt Smart Charts Reference Rows 1.0 is released on 21 December, in memory of Remy.

2010
 April: Diane Webb moderates the Pipeline Database Town Hall at the SLA Pharmaceutical and Health Technology Spring Meeting, featuring representatives from four pipeline database editorial teams.
September: BizInt Smart Charts for Drug Pipelines 3.4 and BizInt Smart Charts for Patents 3.4 are released, with enhanced support for Windows XP and Windows 7 installs. Support is added for Orbit.com, TotalPatents, and USGENE on STN.
October: results of user surveys conducted in early September are presented at the ICIC conference in Vienna.
Additional alpha versions of BizInt Smart Charts Reference Rows are released in 2010.
December: 13-year old dachshund Remy dies during the lunar eclipse on the winter solstice; BizInt Smart Charts Reference Rows is dedicated to his memory.
2009
Development continues on BizInt Smart Charts 3.3, with improved support for Questel and more full-text patent links in BizInt Smart Charts for Patents, and support for Citeline Pipeline and ClinicalTrials.gov in BizInt Smart Charts for Drug Pipelines.
September: The first alpha software is released with "reference row" capabilities.
2008
Development begins on Version 4.0, a new generation of BizInt Smart Charts which will create "reference rows" combining information from related records into a single row in reports.
June: "Surfing the Pipeline – Drug Portfolio Analysis" presented by Diane Webb at SLA 2008 Annual Conference in Seattle WA.
2007
October: BizInt Smart Charts for Patents 3.3 introduces new updating and combining features as well as support for PatBase and links to full-text patents on PatentOrder, espacenet and USPTO.
October: BizInt Smart Charts for Drug Pipelines 3.3 introduces new updating and combining features including detecting changes in updated reports.
2006
January: BizInt Smart Charts for Drug Pipelines 3.1 adds support for links back to records on IDdb and R&D Insight web platforms.
September: BizInt Smart Charts for Patents 3.2 introduces the "Identify Common Patent Families" tool, which automatically matches patent family members across different databases and hosts. Support is added for Prous Integrity, IDdb patents, and GenomeQuest.
 October: BizInt Smart Charts for Drug Pipelines 3.2 introduces chart updating features and support for Adis Clinical Trials Insight.
November: "Surfing the Pipeline: Tracking Changes in Drugs-in-development Databases" presented by John Willmore at the Pharma-Bio-Med conference in Lisbon.
November: BizInt Solutions celebrates its 10th Anniversary.
2005
February: BizInt Smart Charts for Patents 3.0 adds support for Delphion and for generating links from patent numbers to full text patents on MicroPatent and Delphion.
August: BizInt Solutions, Inc. is incorporated in California.
October: BizInt Smart Charts for Patents 3.1 adds support for SciFinder and more literature databases on STN and Dialog.
2004
January: Citeline licenses BizInt Web Charts-Trial Trove Edition as a reporting tool for its TrialTrove internet platform.
 August: BizInt Smart Charts for Drug Pipelines 3.0 is released, adding support for Prous Integrity and Citeline TrialTrove, plus enhanced support for IDdb.
2003
"Surfing the Pipeline" workshops presented in locations around the US.
May: "The Dachshunds of Costello" are on display at the PIUG Annual Conference in Chicago.
2002
 January: First "Surfing the Pipeline" case study comparing drug pipeline coverage and content is prepared for Amgen, inspiring the development of the "Generate Common Drug Name" tool.
August: BizInt Smart Charts for Patents 2.3 adds support for MicroPatent and biomedical literature databases on STN and Dialog.
October: BizInt Smart Charts for Pharmaceuticals 2.4 introduces the "Generate Common Drug Name" tool to identify related compounds across different pipeline databases. Support for pipeline databases on Ovid is also added.
October: "Surfing the Pipeline: Comparing the coverage and content of drugs-in-development databases" presented by Diane Webb at the International Chemical Information Conference in Nimes, France.
 2001
2001
March: BizInt Smart Charts for Patents 2.2 adds 32-bit Windows support and an ability to generate statistics.
April: BizInt Smart Charts for Pharmaceuticals 2.3 adds 32-bit Windows support, NDA Pipeline and Prous Drug Data Report on Dialog, and support for the new Adis Insight web platform.
BizInt Web Charts for Adis Insight (a custom version of BizInt Smart Charts) provides report capabilities for the new Adis Insight internet platform.
November: 5th Anniversary of BizInt Solutions
2000
March: BizInt Smart Charts for Pharmaceuticals 2.1 introduces the ability to create a combined report from Pharmaprojects, R&D Focus, and R&D Insight on DataStar, Lotus Notes and CD-ROM.
August: BizInt Smart Charts for Patents 2.1 adds support for CA/CAplus on STN and patent databases on Dialog.
October: BizInt Smart Charts for Pharmaceuticals 2.2 adds support for the IDdb and pipeline databases on Dialog.
1999
April: BizInt exhibits at our first Patent Information Users Group (PIUG) conference in Alexandria, VA.
October: BizInt Smart Charts for Patents 2.0 adds support for Questel*Orbit, IFI CLAIMS, and API/Derwent Merged File.
 1998
1998
First prototypes of BizInt Smart Charts "Plus" combining reports from multiple databases into a single chart.
August: BizInt Smart Charts for Patents 1.0 is released with support for Derwent World Patents Index on STN. Images are supported for the first time.
1997
August: BizInt Smart Charts for Pharmaceuticals 2.0 is released with support for TDR IPD and HTML export. BizInt Smart Charts Viewer 1.0 is also released.
December: BizInt Solutions delivers DataStar Web Charts, a custom version of BizInt Smart Charts which creates "simple charts" from any database on DataStar.
 1996
1996
November: Diane Webb and John Willmore purchase Smart Charts assets from Experian and establish BizInt Solutions in Orange, California.
December: BizInt Smart Charts for Pharmaceuticals 1.4 is released by BizInt Solutions and demonstrated at the Online Information meeting in London.
TRW Smart Charts (1993-1995)
1995
February: TRW Business Intelligence Systems joins TRW Business Credit Services.

TRW Smart Charts for Pharmaceuticals 1.1, 1.2, and 1.3 add support for more files on DataStar - IMS R&D Focus, Adis R&D Insight and Adis LMS Alerts.
December: TRW ceases development and marketing of TRW Smart Charts for Pharmaceuticals.
1994
March: TRW Business Intelligence Systems is established by ESL to develop commercial software products.
August: TRW Smart Charts for Pharmaceuticals 1.0 is released with support for searching and creating tabular reports from Pharmaprojects on DataStar.
1993
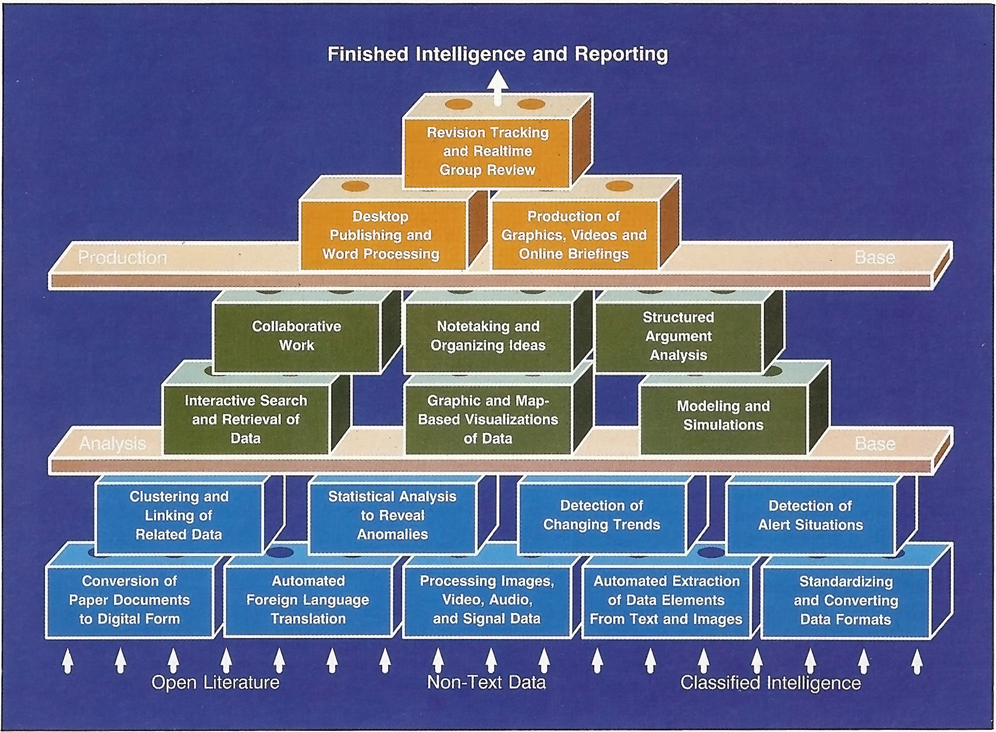 "Infosight" defense conversion venture launched at ESL (a subsidiary of TRW Space & Defense in Sunnyvale CA), based on technology developed for the CATALYST (Computer-Aided Tool for Analysis of Science and Technology) program. Diane Webb, author of the CATALYST paper (22 MB PDF), is the product leader. John Willmore joins the team as head of software development.

