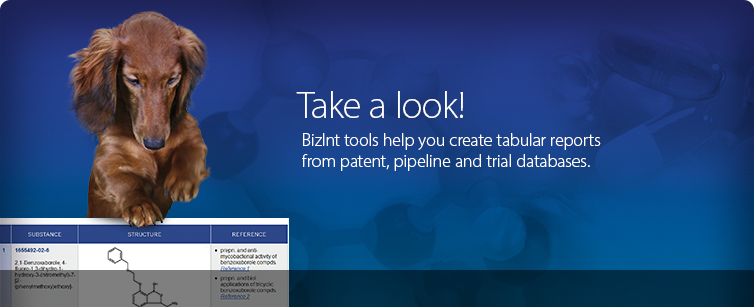
Create, customize and distribute tabular reports integrating data from the leading patent, IP sequence, and scientific/technical literature databases and hosts.
BizInt Smart Charts for Patents is Windows software installed on your computer.
VantagePoint – Smart Charts Edition (VP-SCE) provides powerful tools to help you clean-up, filter, analyze and visualize BizInt Smart Charts data.

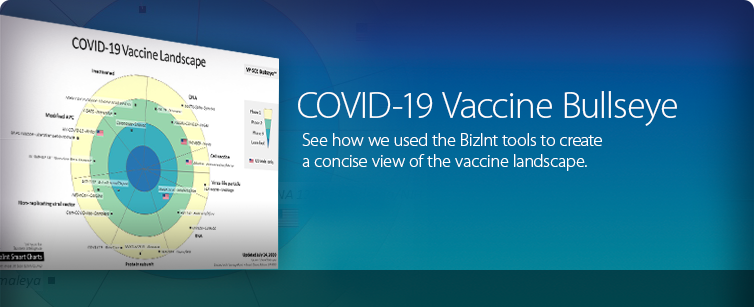
BizDash is a service offering fast creation of drug and clinical trial landscapes -- including powerful visualizations like pipeline bulleyes -- integrating data from key pipeline and trial databases.
BizInt Smart Charts is your solution for integrating data from drug pipeline, patent, IP sequence, and clinical trials databases.
Since 1996, IP searchers, CI analysts, and information professionals have used the BizInt Smart Charts product family to create multi-database reports and visualizations, turning search results into intelligence as a foundation for strategic decisions.
Learn more »
Learn how to use the BizInt tools to create powerful and effective reports and visualizations, with examples and step-by-step recipes.
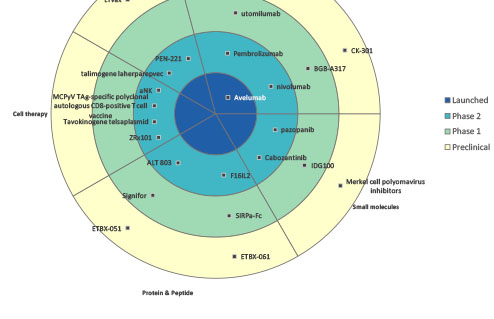
LEARN MORE | DOWNLOAD COOKBOOKFeatured recipe: Visualizing the Pipeline with a VP-SCE℠ Bullseye

Attend one of our webinars to learn about key BizInt Smart Charts features. Register for an upcoming webinar or view recordings of previous webinars on our eLearning webinars page.
UPCOMING & PAST WEBINARSFeatured webinar: COVID-19 trials