Resources
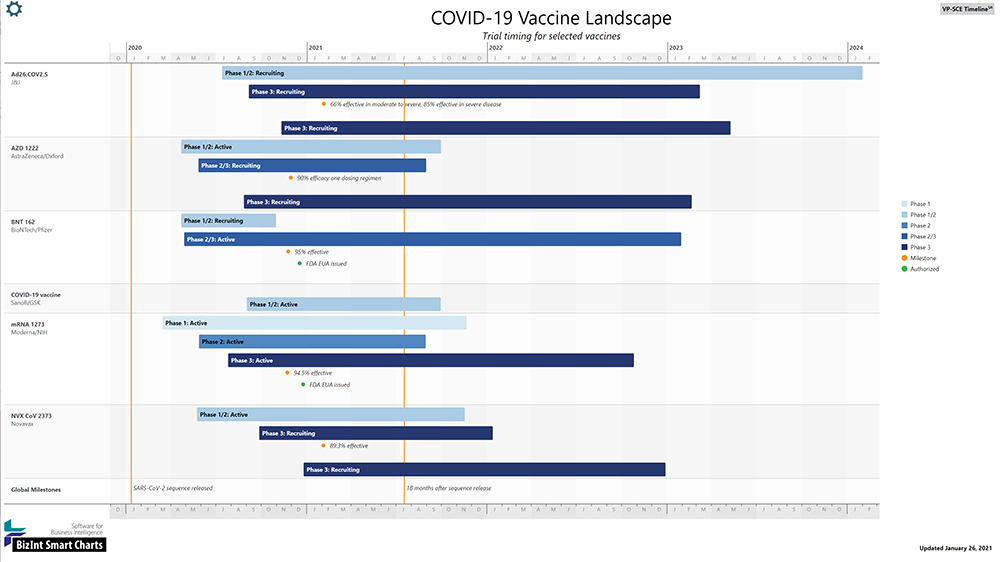
COVID-19 Vaccine Timeline
January 26, 2021
The COVID-19 pandemic has generated intense interest in efforts by the global pharmaceutical community to develop COVID-19 vaccines. The BizInt Smart Charts team has applied tools in the BizInt Smart Charts product family, including VantagePoint – Smart Charts Edition (VP-SCE), to create a concise visualization of clinical trial timing and milestones for leading COVID-19 vaccines.
You can see other visualizations in this family on our COVID-19 Vaccine Dashboard.
click image to enlarge
About the COVID-19 Vaccine Timeline
Development of a vaccine for COVID-19 is being pursued at an unprecedented pace. Part of the gains in development speed come from running safety and efficacy trials concurrently. We have developed this timeline to help understand the progress of testing these vaccines.
This COVID-19 Timeline shows vaccines with Phase 3 trials in progress, as reported in clinicaltrials.gov. We have labeled each vaccine with a commonly used name, and by the organizations leading the development.
For each vaccine project, we show the status and duration of key trials, as well as selected milestones from the press.
The National Institutes of Health describe clinical trial status as follows:
- Phase 1: Studies that are usually conducted with healthy volunteers and that emphasize safety. The goal is to find out what the drug's most frequent and serious adverse events are and, often, how the drug is metabolized and excreted.
- Phase 2: Studies that gather preliminary data on effectiveness (does the vaccine invoke an immune response). Safety continues to be evaluated, and short-term adverse events are studied.
- Phase 3: Studies that gather more information about safety and effectiveness by studying different populations and different dosages and by using the drug in combination with other drugs.
You may notice that many of the trials are labeled with two phases, such as Phase 1/2 or Phase 2/3. In these trials, the volunteers will be evaluated for several purposes during the course of the investigation. For example, in a Phase 2/3 trial, a subject may be tested for a Phase 2 criterium, such as to see whether the vaccine provokes an immune response, and will subsequently be followed in Phase 3 to see whether the vaccine protects against COVID-19.
Multi-phase trials like this are not uncommon in drug development, but are a key strategy for the rapid evaluation of COVID-19 vaccines. It is helpful to think of these trials as multiple trials run concurrently using the same subjects. The primary endpoints of many of these trials reflect this strategy. As such, you can expect to see intermediate results published from all of these trials, even as the trial continues to monitor the volunteers and collect data.
What Has Changed In This Update?
This is our first draft of the COVID-19 Timeline.
Do You Find This Timeline Interesting?
The COVID-19 Timeline is an example of a BizDash project. BizDash (BizInt Smart Strategy Dashboards) is a service offered by the BizInt team. We use BizInt Smart Charts tools with supported drug pipeline, clinical trial and biomedical literature databases to create data-centric reports and visualizations targeted to your analytic needs.
Contact us if you would like to learn more.
How We Built This
The VP-SCE Timeline for COVID-19 vaccines uses data from clinicaltrials.gov, expert analysis, and the powerful data analysis and visualization software tools in the BizInt Smart Charts product family to create a timeline-styled graphic, demonstrating planned progress towards a COVID-19 vaccine.
- We searched NIH ClinicalTrials.gov using the link on the clinicaltrials.gov homepage for "clinical studies related to the coronavirus disease (COVID-19)." The standard exports offered by clinicaltrials.gov do not include all necessary fields. The only export with the full set of fields is XML. This includes essential data for the bullseye visualization including trial sponsors and countries. We used the BizInt Smart Charts Drug Development Suite to import the XML file and automatically create a tabular view. This table was then exported to VantagePoint - Smart Charts Edition (VP-SCE) for further analysis and to generate the visualization.
- We filtered to vaccine trials and identified the vaccines in Phase 3 testing. From the full set of trial records, a keyword search was run with VP-SCE and reviewed to identify trials for vaccines. That identified set of trials was checked against other public information to identify additional vaccines. For clarity's sake, vaccines currently marketed for another disease were omitted.
- We ran a second search to find additional trials for the Phase 3 candidates. Some of the earlier trials for these Phase 3 vaccines do not list COVID-19 as a condition being tested, and are not returned by the standard ClinicalTrials.gov search. We searched each vaccine name separately to find additional trials, and combined the search results into one set using BizInt Smart Charts. We augmented this search with data from the Chinese Clinical Trial Registry when earlier trials could not be found in ClinicalTrials.gov.
- For each vaccine, we reviewed the press for mentions of key milestones. Milestones were captured in our table, and assigned to one of the trials. Examples of milestones may include first dosing, readouts of intermediate endpoint results, or regulatory activities.
- We refined data to normalize terminology. Cleanup tools in VP-SCE enabled easy review of drug and sponsor information to select a single drug name and a key sponsor or sponsors for each vaccine.
- We generated the timeline visualization. We are using VP-SCE to generate a rough visualization, which is currently being refined in Adobe Illustrator. As we refine this presentation, we will be working on building this timeline automatically.
- We are updating the timeline on a regular basis. To generate a new timeline we use the Update tool in BizInt Smart Charts to automatically identify new trial records as well as records that have changed. This streamlines the process of generating a new timeline since only a fraction of the trial records need to be reviewed.
Notes
- The timeline is updated every two weeks. Current content on ClinicalTrials.gov may be different due to the rapid pace of change in this area.
- Only vaccines with Phase 3 trials in ClinicalTrials.gov are included in this analysis. Trial data is from ClinicalTrials.gov for all trials with the exception of the Phase 1/2 trial of Sinopharm's vaccine, which comes from the Chinese Clinical Trial Registry.
Bibliography
- Lu R, Zhao X, Li J, et al. Genomic characterisation and epidemiology of 2019 novel coronavirus: implications for virus origins and receptor binding. Lancet. 2020;395(10224):565-574.
doi: 10.1016/S0140-6736(20)30251-8 - VRBPAC October 22, 2020 Meeting Announcement. Fda.gov. https://www.fda.gov/advisory-committees/advisory-committee-calendar/vaccines-and-related-biological-products-advisory-committee-october-22-2020-meeting-announcement. Published September 9, 2020. Accessed September 10, 2020.
- Mercado NB, Zahn R, Wegmann F, et al. Single-shot Ad26 vaccine protects against SARS-CoV-2 in rhesus macaques. Nature. 2020:1-11.
- Folegatti PM, Ewer KJ, Aley PK, et al. Safety and immunogenicity of the ChAdOx1 nCoV-19 vaccine against SARS-CoV-2: a preliminary report of a phase 1/2, single-blind, randomised controlled trial. Lancet. 2020;396(10249):467-478.
- Walsh EE, Frenck R, Falsey AR, et al. RNA-based COVID-19 vaccine BNT162b2 selected for a pivotal efficacy study. 2020. doi:10.1101/2020.08.17.20176651
- Feuerstein A, Gopalakrishna P, Chakradhar S, Proujansky A, Garde D. Sinovac says its Covid-19 vaccine generated immune responses - STAT. Statnews.com. https://www.statnews.com/2020/06/14/sinovac-early-data-covid19-vaccine-generated-immune-responses/. Published June 14, 2020. Accessed September 10, 2020.
- Jackson LA, Anderson EJ, Rouphael NG, et al. An mRNA vaccine against SARS-CoV-2 — preliminary report. N Engl J Med. 2020;(NEJMoa2022483). doi:10.1056/nejmoa2022483
- Xia S, Duan K, Zhang Y, et al. Effect of an inactivated vaccine against SARS-CoV-2 on safety and immunogenicity Outcomes: Interim analysis of 2 randomized clinical trials. JAMA. 2020;324(10):951-960.
COVID-19 Visualization Archive
- September 1, 2021 — The BioNTech/Pfizer vaccine is now fully approved, progress for NovaVaxx, and a new intranasal program from CyanVac.
- August 2, 2021 — A quiet month with no changes visible on the bullseye.
- June 29, 2021 — Moderna program for the 351 variant starts phase 3 trials in the US. We also added a ring in anticipation of a full approval of one or more vaccines.
- June 1, 2021 — Sanofi/GSK program moves starts phase 3 trials including in the US.
- May 18, 2021 — No changes in the US/UK/EU bullseye, but quite a bit of activity in the rest of the world.
- May 4, 2021 — A small update this time, with one new vaccine project and one phase change.
- April 20, 2021 — Updating both the US/UK/Europe bullseye and the bullseye for programs in the rest of the world. Four new vaccine programs appear.
- April 6, 2021 — We have updated the US/UK/Europe bullseye and the corresponding piano chart. Two new vaccines appear, one starting trials, and one newly listing trials in the regions we are watching.
- March 23, 2021 — We have updated both the US/UK/Europe bullseye and the Rest Of World version, as well as adding a piano chart to show some of the detail on the US/UK/Europe data. Quite a bit of updates... click through to read more.
- March 9, 2021 — This update looks at the US/UK/Europe vaccine development, and reflects the emergency authorization of the Janssen (J&J) vaccine.
- February 23, 2021 — The first update of our COVID-19 landscape using commercial data sources. We have split the data set into programs in the US/UK/Europe and a second set for the remaining vaccines, which is easy with these databases.
- February 9, 2021 — A reset in our COVID-19 landscape, we have rebuilt the bullseye using data from commercial drug pipeline databases rather than clinicaltrials.gov. We are still working through the implications, but this is a good first look at the new direction.
- January 26, 2021 — A bullseye showing the current state of COVID-19 vaccine development, with very little movement from the previous report.
- January 12, 2021 — A bullseye showing the current state of COVID-19 vaccine development, featuring an EUA request for the AZ/Oxford vaccine.
- December 29, 2020 — A bullseye showing the current state of COVID-19 vaccine development, featuring the authorization of a second vaccine, this time from Moderna.
- December 15, 2020 — A bullseye showing the current state of COVID-19 vaccine development, featuring the authorization of the Pfizer/BioNTech vaccine in the US.
- December 1, 2020 — A bullseye showing the current state of COVID-19 vaccine development, showing several phase changes and two new vaccines.
- November 17, 2020 — A bullseye showing the current state of COVID-19 vaccine development, with two new vaccines in Phase 1.
- November 3, 2020 — A bullseye showing the current state of COVID-19 vaccine development, with a new vaccine from IIBR.
- October 20, 2020 — A bullseye showing the current state of COVID-19 vaccine development, with the Novavax project moving into Phase 3 and two new vaccines appearing.
- October 6, 2020 — A bullseye showing the current state of COVID-19 vaccine development, with trials for four new vaccines appearing.
- September 22, 2020 — A bullseye showing the current state of COVID-19 vaccine development, with trials for two new vaccines appearing.
- September 10, 2020 — A first timeline showing trials for the Phase 3 candidates.
- September 8, 2020 — A bullseye showing the current state of COVID-19 vaccine development. Several new projects listed, and several projects move to higher phase.
- August 25, 2020 — A bullseye showing the current state of COVID-19 vaccine development. Grouping all Viral Vector projects together now. Trials for one new Sinopharm vaccine added in Phase 3.
- August 11, 2020 — A bullseye showing the current state of COVID-19 vaccine development. J&J vaccine now appears in clinicaltrials.gov searches, three other new vaccine projects, and one new technology detected.
- July 29, 2020 — A bullseye showing the current state of COVID-19 vaccine development. BioNTech/Pfizer trials move to Phase 3.
- July 28, 2020 — A bullseye showing the state of COVID-19 vaccine development.
- July 14, 2020 — A bullseye showing the state of COVID-19 vaccine development. Moderna/NIH trials move to Phase 3.
- July 7, 2020 — The first bullseye showing the state of COVID-19 vaccine development.
Media Inquiries
Timeline Events
- Sequence released
Lu, et al. published the full genetic sequence of SARS-CoV-2 in The Lancet on January 30, 2020. This allowed scientists around the world to start work on developing vaccines. - 18 months after sequence published
On March 2, 2020, Dr. Anthony Fauci stated that the development of a vaccine will take from a year to a year and a half. We mark the 18 month point on the timeline as a reference. - FDA Advisory Committee Meeting
The FDA announced that it would be holding an Advisory Committee meeting on October 22, 2020 to review development and licensing of vaccines for COVID-19. Subsequent meetings will be scheduled as needed when companies submit applications. - 3 months post Phase 3 start
We found it helpful to show the point three months into the Phase 3 trials as a marker for the earliest date that data could be expected. - Immune Response
All of the vaccines on this timeline have published initial results on whether the product generates an immune response. We have marked these events on the timeline under the corresponding trial. So far we have only
seen pre-clinical study results reported for Ad26.COV2.S


