News & Events
BizInt Smart Charts at DIA 2016
 Are you looking for new ways to leverage trial data from public and commercial sources and to deliver decisive intelligence for your clinical trial design?
Would you like to better understand competitors' pipelines to inform strategic decision making?
The BizInt Smart Charts product family provides Windows-based software package to help you create reports and visualizations integrating information from the leading clinical trials and drug pipeline databases.
Professional Poster Presentation on Tuesday, June 28
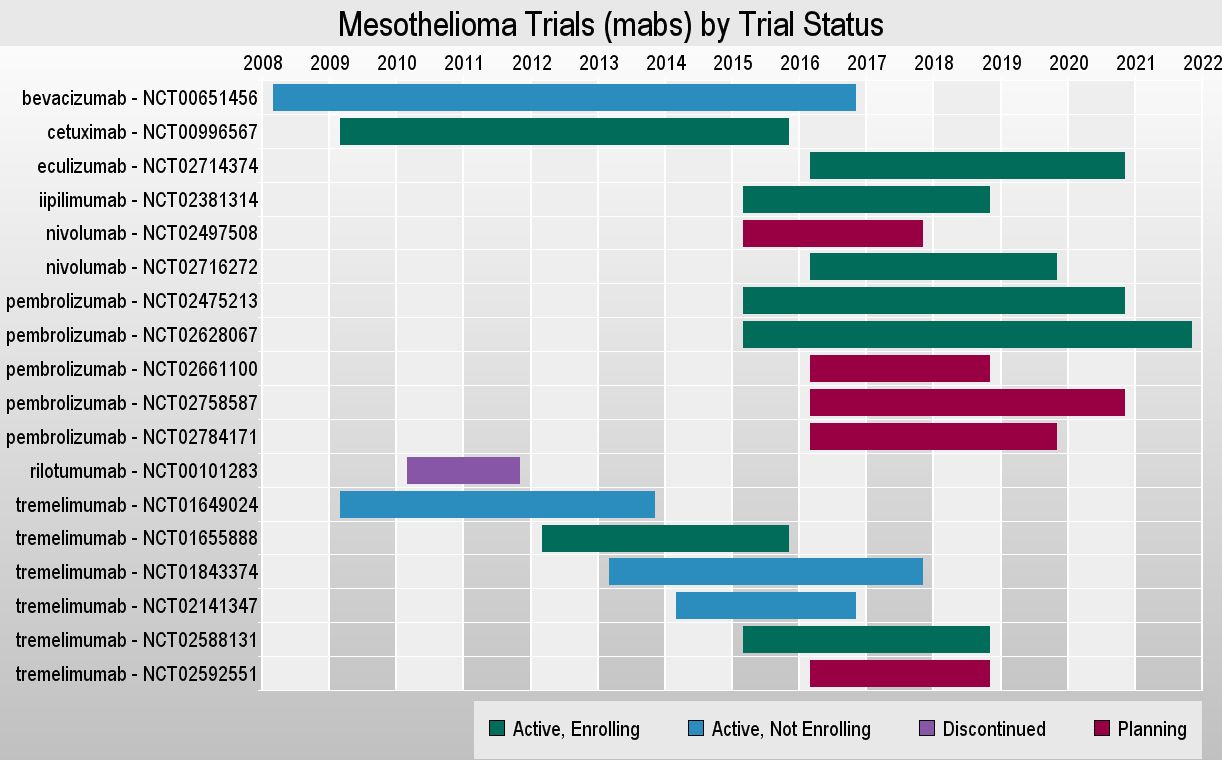
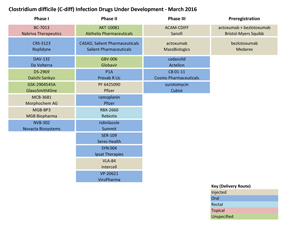
A highlight of our presence at DIA was meeting with several attendees to discuss our poster -- "Comparative Strengths of Public and Commercial Clinical Trials Databases: A Case Study."
View the full poster or our handout from the session.
note: Cortellis Competitive Intelligence, not Cortellis Clinical Trials Intelligence, was the source of Cortellis trials data in the case study.
Try It Today!
We invite you to download a fully-functional trial of our complete suite, BizInt Smart Charts Drug Development Suite.
BizInt Smart Charts for Clinical Trials
With BizInt Smart Charts for Clinical Trials, you can create reports integrating trial data from public (ClinicalTrials.gov, EudraCT, WHO ICTRP) and commercial (Citeline TrialTrove, Adis Clinical Trials Insight, Cortellis Trials Intelligence) databases.
BizInt Smart Charts for Drug Pipelines
With BizInt Smart Charts for Drug Pipelines, you can create reports integrating drug pipeline information from the leading pipeline databases, including Citeline Pharmaprojects, Thomson Cortellis, Adis R&D Insight, IMS R&D Focus and Thomson Integrity.
VantagePoint - Smart Charts Edition
 Use the VantagePoint - Smart Charts Edition (VP-SCE) to clean-up terminology, filter key information and create targeted visualizations from your BizInt Smart Charts reports.

