News & Events
 2018 BizInt Smart Charts Analytics and Visualization Seminar
Friday, October 12, 2018
Residence Inn Boston Cambridge - (Directions)
120 Broadway, 6 Cambridge Center
Cambridge, MA 02142 Phone: 1-617-349-0700
![]()
Would you like to learn more about creating effective reports and visualizations to support your analysis?
 Join us for the 2018 BizInt Smart Charts Analytics and Visualization Seminar and learn how to use the tools in the BizInt Smart Charts product family to create drug pipeline, clinical trial and IP reports and visualizations.
The seminar includes four practical workshops (see below for more details):
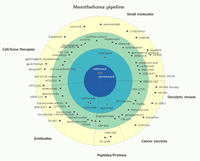
- Creating a Pipeline Bulls-Eye (Pipeline)
- Cookbook Training Recipes (Clinical Trials)
- Creating Hit Structure Reports (Patents)
- Creating IP Sequence Reports (Patents)
If you want "hands-on" experience, bring your laptop and follow along!
You will also learn about the latest features in Version 5 of BizInt Smart Charts Drug Development Suite and BizInt Smart Charts for Patents.
 The morning session will focus on clinical trial and drug pipeline data. The afternoon session will focus on IP data, including hit structures and IP sequence data. Between the morning and afternoon sessions will be a Lunch and Learn presentation on Visualizing Clinical Trial Endpoints.
You can register for any or all of these sessions. You are welcome to come only for lunch if you like! The schedule includes time for networking with other analysts and BizInt Smart Charts users. And yes, there will be puppy photos and dachshund sport videos.
Location: The Residence Inn Boston Cambridge is located in the heart of Kendall Square, on the corner of Broadway and Ames Street. It is a few minutes walk from the MIT Kendall Square red line station. There is a public parking garage behind the hotel.
The seminar is free and is designed for both new, prospective and advanced users of BizInt Smart Charts and VantagePoint - Smart Charts Edition (VP-SCE). Breakfast and lunch will be provided.
Questions? Please contact BizInt Solutions.
![]()
Agenda
| 8:30 - 9:15 am | Registration & Breakfast |
| 9:15 - 9:45 am | Welcome and What's New in BizInt Smart Charts Drug Development Suite 5.0? Learn about support for next generation Citeline, improved identify common drug and trial tools, and our plans for enhanced support of literature databases. |
| 9:45 -10:30 am | Workshop 1 (Pipeline) - Creating a Pipeline Bulls-Eye. Learn how to integrate results from different pipeline databases (including the next generation Pharmaprojects) into a single report, and then use this report to create a bulls-eye visualization with VantagePoint - Smart Charts Edition (VP-SCE). |
| 10:30 - 11:00 am | Break |
| 11:00 am - 12:00 pm | Workshop 2 (Trials) - Key Data Clean-Up and Visualization Features. In this workshop, we will start with a clinical trials dataset (CT.gov and EudraCT), show how to prepare it with Reference Rows, and then apply key features in VP-SCE to clean up the data and create a Piano Chart and Trial Completion Timeline. |
| 12:00 - 1:15 pm | Lunch & Learn: "Visualizing Clinical Trial Endpoints" presented by Matt Eberle, BizInt Solutions. Based on a poster presented at DIA 2018, Matt will discuss how endpoint terms can be extracted and normalized from clinical trial databases to build reports and visualizations. Data sources include CT.gov, EudraCT, and Cortellis Trials Intelligence. |
| 1:15 - 1:30 pm | What's New in BizInt Smart Charts for Patents 5.0? Learn about about the latest supported databases and our plans for enhanced support of literature databases. |
| 1:30 - 2:15 pm | Workshop 3 (Patents) - Creating Hit Structure Reports: In this workshop, you will learn how to use BizInt Smart Charts for Patents to create a structure-oriented index to retrieved CAplus references from the results of a structure search in CAS REGISTRY on STNext. We will share several possible variations on this report, including showing how to fuse claims from full text patent databases on STNext with hit structure results from CAplus. |
| 2:15 - 2:45 pm | Break |
| 2:45 - 3:30 pm | Workshop 4 (IP Sequence) - Creating IP Sequence Reports - In this workshop we will show how to use BizInt Smart Charts for Patents to create reports from sequence searches on GenomeQuest and STN. From there, we'll use BizInt Smart Charts Reference Rows to build a report integrating both sequence results with value-added content from patent family databases (e.g. Patbase, Orbit, etc.) |
| 3:30 - 4:00 pm | Wrap-up & Q&A |
| 4:00 - 5:00 pm | BizInt staff available for individual training, discussion, and follow-up |
Seminar Presenters
John Willmore and Diane Webb are the co-founders of BizInt Solutions Inc., which develops and markets the Smart Charts software product line. Prior to the founding of BizInt Solutions in 1996, they managed the product team at TRW Inc., which created the initial Smart Charts concept and software. They have almost 30 years of experience in processing, analyzing and integrating drug pipeline and patents information. 
Matt Eberle worked extensively with both BizInt Smart Charts for Drug Pipelines and BizInt Smart Charts for Patents for over ten years at Wyeth, Pfizer and Sunovion, where he held positions of Senior Information Scientist and Pharmaceutical Information Analyst. He joined the BizInt Solutions team in July 2013 as Product Specialist.
![]()

