News & Events
BizInt Smart Charts at DIA 2017
 Are you looking for the right ingredients for your regulatory strategy, clinical trial design, or competitor intelligence?
At DIA 2017, we showed how the BizInt Smart Charts product family can help create reports and visualizations from the leading clinical trials and drug pipeline databases to answer questions such as:
- Who are the key competitors for our lead compound?
- Where is our key competitor compound being tested in clinical trials?
- What do the registries show as key trial sites for my drug?
- Are competitor trials using the same primary endpoints?
- What trials are actively recruiting?
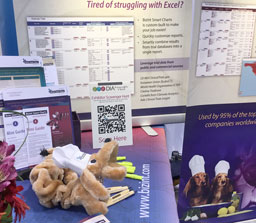
Tired of struggling with Excel? BizInt Smart Charts knows how to process your data -- no more copy/paste or maintaining Excel macros.
Professional Poster Presentations at DIA 2017
 BizInt team members presented two posters at the DIA 2017 Professional Poster session:
Searching the registries for trial submission QA and competitor intelligence - Comparing ClinicalTrials.gov and EudraCT (Matt Eberle). Download the poster handout.
What’s the Best Download Format from NIH ClinicalTrials.gov? Comparing Data Availability in Different Export Options (John Willmore). Download the poster handout.
Note: page 1 of the What’s the Best Download Format from NIH ClinicalTrials.gov? handout discusses the new ClinicalTrials.gov website and the new download options.
See also:
"Comparative Strengths of Public and Commercial Clinical Trials Databases: A Case Study." presented by Matt Eberle at the DIA 2016, Philadelphia, PA, June 2016.
Try It Today!
We invite you to download a free, fully-functional trial of the BizInt Smart Charts Drug Development Suite, with tools to support clinical trial and drug pipeline data.
BizInt Smart Charts for Clinical Trials
With BizInt Smart Charts for Clinical Trials, you can create reports integrating trial data from public (ClinicalTrials.gov, EudraCT, WHO ICTRP) and commercial (Citeline TrialTrove, Adis Clinical Trials Insight, Cortellis Trials Intelligence) databases.
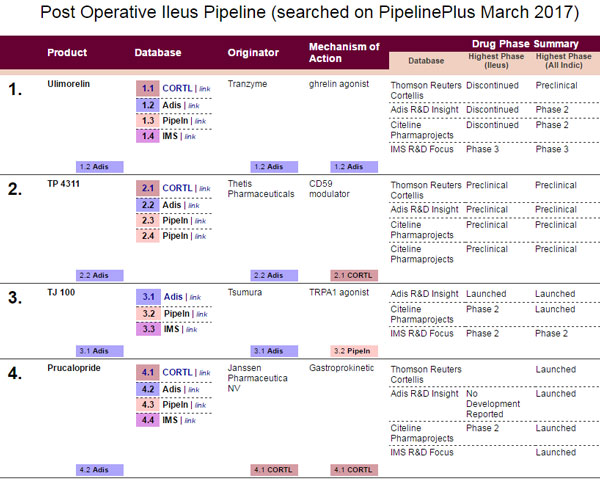
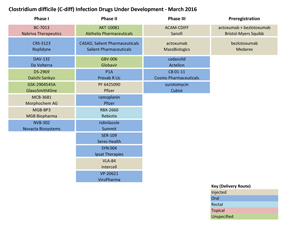
BizInt Smart Charts for Drug Pipelines
With BizInt Smart Charts for Drug Pipelines, you can create reports integrating drug pipeline information from the leading pipeline databases, including Citeline Pharmaprojects, Cortellis from Clarivate Analytics, Adis R&D Insight, IMS R&D Focus and Integrity.
VantagePoint - Smart Charts Edition
 Use the VantagePoint - Smart Charts Edition (VP-SCE) to clean-up terminology, filter key information and create targeted visualizations from your BizInt Smart Charts reports.

