 help: support@bizint.com
Products: VantagePoint - BizInt Smart Charts Edition
Samples
On this page you'll find examples of how VantagePoint tools can create enhanced columns in BizInt Smart Charts:
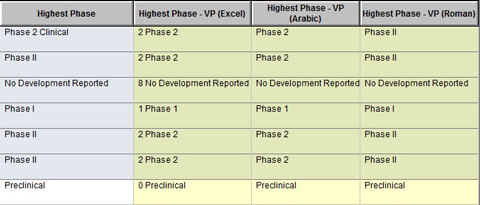
Drug Pipeline Report: normalize phase names according to your own preferences (3 examples shown below).
Clinical Trials Report: normalize drug names, study phase, and study status.

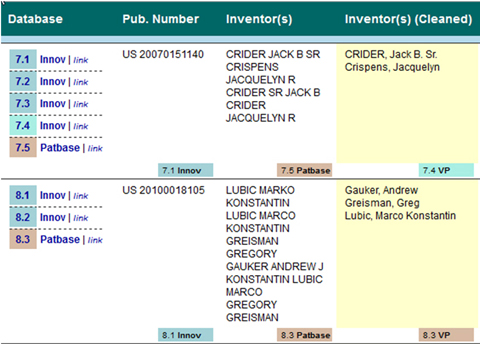
Patents Report: clean-up Inventor names.
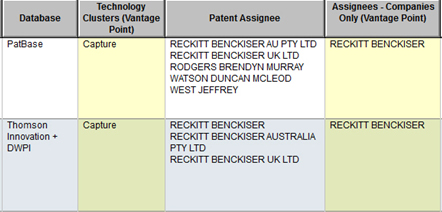
Patents Report: identify technology clusters, and extract and normalize company names from Assignees.
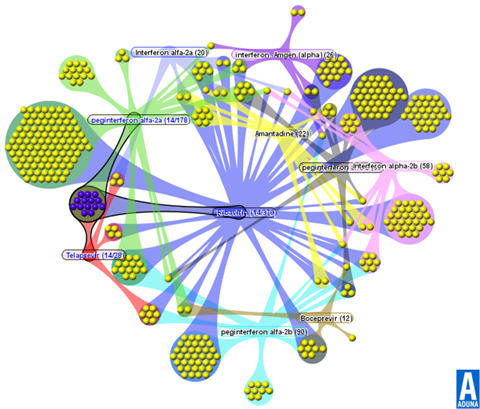
Clinical Trials: Aduna visualization of key drugs used in Hepatitis-C trials, after cleanup in VantagePoint and deduplication in Reference Rows.


Copyright © 1996-2024 BizInt Solutions, Inc. All Rights Reserved